


In our last blog post, we talked about how to track Mainline Linux Kernel Performance in Cloud Environments. In this blog, we examine the architecture of a working Linux kernel performance regression detection system: how payloads are selected and test plans generated, how target kernels are built and benchmarks executed, and how results are processed into reproducible regression signals and visualised. The analysis distinguishes regressions that reproduce across the expected range of concurrency from effects that appear only at a single level. The system is built around existing kernel testing infrastructure - Linux Kernel Functional Testing (LKFT) is a set of tools and projects providing a kernel functional testing service.
Goals and Boundaries
The purpose of this system is to continuously produce decision-grade regression signals for Linux kernel performance testing in cloud environments (or Linaro Automation Appliance (LAA)-based labs): valid comparisons, robust statistics, and actionable prioritization including emphasis on signals that reproduce across multiple tested conditions. The system is not a profiler and does not attempt to localize root cause at the commit and further – function level, at least at the current state of development.
Architecture Overview
The system is built around a simple separation into three layers - execution generates raw artifacts, analytics turns them into regression signals and visualization. The boundary between these layers is intentional: it makes every conclusion traceable to inputs - kernel source/build/env/benchmark parameters.
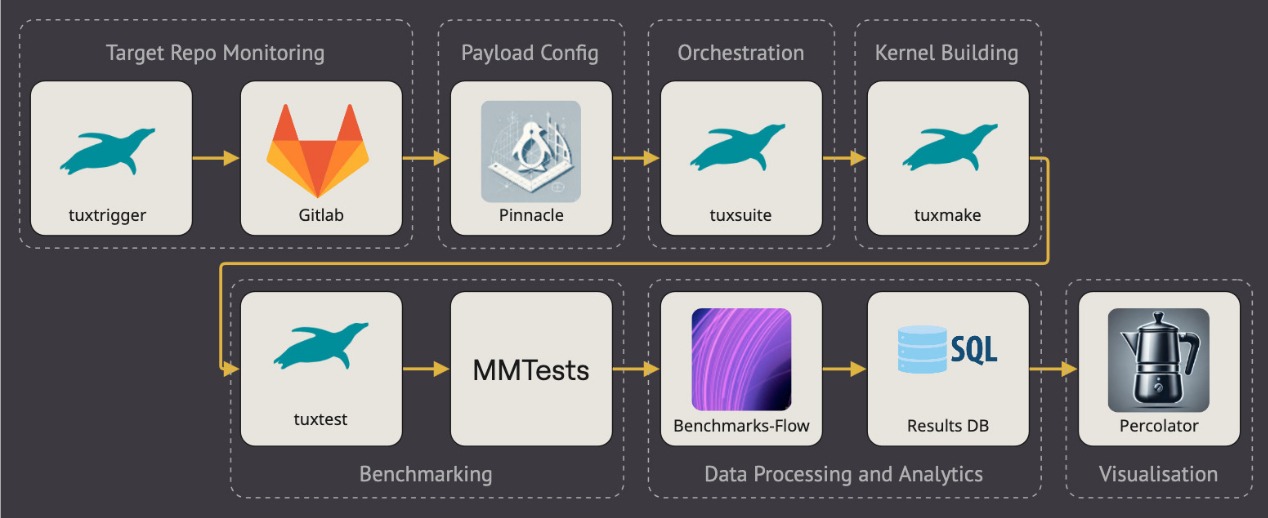
The diagram maps the mentioned layers to exact components. First steps correspond to an execution path that produces benchmark outputs together with the required context: kernel version, build configuration, runtime parameters, system information, and benchmark parameters. This stage is triggered by new release tags in the target Linux repository. This ensures that every measurement is tied to a fully defined environment.
The data processing and analytics segment is where raw artifacts are converted into structured results and preserved with their metadata, so later comparisons remain valid and traceable to inputs. This is also where statistical analysis, variance handling, and multiple-testing control are applied. The output is not just measurements, but classified regressions.
The final stage is – visualisation. Instead of showing raw delta tables, the system presents prioritized and structured findings mapped to kernel subsystems, allowing engineers to focus on meaningful performance changes..
Execution vs Analytics
The execution plane is responsible for what is tested and how it is tested:
- Pinnacle compiles the desired payload configuration into a versioned TuxSuite test plan according to experiment design. Each plan explicitly defines kernel source and git SHA, toolchain and kernel configuration, target device or instance type and the required minimal number of instances and repetitions, benchmark workloads and other parameters.
- Tuxsuite executes the plan: builds kernels with the specified toolchain and configuration, provisions the required amount of targets, runs benchmarks, and collects artifacts.
- MMTests is used as the workload execution framework, providing a consistent way to run and parameterize benchmarks. The benchmark selection intentionally focuses on workloads that exercise generic kernel mechanisms rather than narrow subsystem features. Suites such as unixbench, sysbench, stress-ng, and will-it-scale cover core areas like scheduling, memory management, synchronization primitives, and system call paths. These code paths are shared across most applications, which means regressions detected here are likely to have broad impact across different workload types rather than being limited to a specific subsystem or device class.
The output of the execution plane is not a single number but a set of raw, versioned artifacts: benchmark results, logs, build metadata, and environment information.
The analytics plane is responsible for turning raw artefacts into decision‑grade regression signals.
-
Benchmarks-flow consists of modules, which ingest results, parse artifacts/logs, compute hierarchical statistics across runs, benchmarks, tests, and operations, and perform baseline/target comparisons. On top of that data, other modules convert comparisons into regression decisions using significance, effect size, stability/consistency, and severity scoring systems.
-
Percolator reads prepared data and provides a visualisation of structured drill-down from high-level findings (kernel as a whole) to individual benchmark executions and raw measurements.
This design guarantees that the same data and logic always produce the same conclusions, regardless of how the results are explored.
Payload Selection and Test Plan Generation
Performance testing requires precise control over what is tested and how. Pinnacle utility defines the payload - which kernel revisions to test, on which targets, with which benchmarks and parameters. It generates versioned TuxSuite plans that include:
- Kernel repo URL and required Git SHA
- Target hardware
- Kernel config and required toolchain
- List of benchmarks and particular tests inside suites
- Number of instances and repetitions
- Runtime flags and additional metadata
Pinnacle supports both full test matrices and filtered runs, enabling scalable and targeted performance measurements. It integrates with tuxtrigger to monitor repositories and regenerate plans automatically on new release tag pushes.
All plans are stored and versioned for traceability and reproducibility.
Kernel Builds and SUT Provisioning
Once a test plan is defined, TuxSuite schedules and executes it end-to-end. It builds kernels with the specified configuration and toolchain, provisions system-under-test (SUT) environments, runs the requested benchmarks, collects all output artifacts, and stores them in the corresponding SQUAD project.
TuxSuite handles both virtual and physical targets, abstracting platform-specific setup. It ensures consistent, repeatable provisioning.
The result is a structured artifact package, which includes kernel boot logs, dmesg, benchmark outputs, system info, ready for ingestion and analysis.
Data Ingestion and Processing
Execution produces a large set of raw artifacts of different kinds, but these artifacts are not directly usable for regression analysis. They must be ingested, normalized, and processed into structured data before any regression decision can be made. This responsibility is handled by individual modules of benchmark-flow ( bflow ) project. These modules are used in the standard GitLab CI pipeline which is triggered automatically by tuxtrigger or manually. Bflow modules continuously ingest results from upstream systems, such as SQUAD. It does not assume that experiments arrive in a fixed order or complete simultaneously. Instead, it supports incremental processing, allowing partial results to be parsed and recorded as soon as they become available.
During ingestion, bflow:
- downloads and de‑duplicates raw artifacts,
- parses benchmark outputs and logs,
- extracts build, kernel, software, and hardware metadata,
- associates results with a deterministic experiment identity derived from a combination of parameters.
This step converts loosely structured execution artifacts into a normalized, queryable dataset while preserving full traceability to original files.
Once ingested, the pipeline computes hierarchical statistics at multiple levels:
- individual benchmark operations,
- benchmark tests,
- full benchmark suites,
- and complete experiment runs.
These statistics form the foundation for all subsequent comparisons. Importantly, raw measurements are preserved alongside aggregated values, allowing re‑analysis when methodology or thresholds change without re‑running experiments.
Results Analysis and Classification
After ingestion, structured data must be compared across baseline and target kernel versions to identify potential regressions. This step is not a simple diff, but requires robust statistical methodology to filter out noise and detect real performance shifts.
An essential step is selecting a baseline version for each target. In automated workflows, this is handled by a deterministic rule: the baseline is set to the previous minor stable release. For example, for target v6.11 or v6.12-rcN, the baseline becomes v6.10 or v6.11, respectively. RCs and post-release commits are excluded from baseline selection. This ensures comparisons are made against stable, reproducible references and prevents time drift. Manual baseline overrides are supported but optional.
With baselines defined, the pipeline computes statistics across repeated runs and instances. Comparisons are made only between experiments that match in kernel configuration, toolchain, hardware, benchmark parameters, and environment to ensure an apples-to-apples comparison.
Each comparison is evaluated along several dimensions:
- Statistical significance – to assess whether the difference is likely real.
- Effect size – to measure how large the difference is relative to variation.
- Stability and consistency – to detect flaky or environment-sensitive results.
- Severity scoring – to rank regressions by potential impact.
These inputs are combined into a classification outcome:
- Regression — significant and meaningful degradation
- Improvement — significant and meaningful gain
- No change — no statistically significant or impactful difference
- Uncertain — signal exists, but lacks strength or stability to classify reliably
This process produces a structured, reproducible set of findings that can be directly surfaced to users for review, triage, or reporting.
Classification Summary (1520 total regressions):
================================================================================
Red (247):
  - futex3-threads/futex3 ops[2] exp:8472f8a828861511/6a79292489cdc639 (v6.16 / v6.17) -12.7% [Score: 87.5]
  ...
  - pthread_mutex1-threads/pthread_mutex1 ops[21] exp:8472f8a828861511/21e588a36c7405a9 (v6.16 / v6.17-rc2) -8.6% [Score: 87.5]
  ...
Yellow (319):
  - execl/execl[128] exp:e9936429ec8ec111/4f238a19eafc138c (v6.3 / v6.4) -5.1% [Score: 67.5]
  ...
  - bad-altstack/bad-altstack ops[32] exp:6a242d0b0b587457/15d69162396d375e (v6.18-rc7 / v6.18) -5.3% [Score: 67.5]
  ...
Systematic Regression Detection
Not all regressions are equal. Some appear only at specific concurrency levels or on specific hardware configurations. Others are consistent across the full range of tested conditions. This step identifies the latter — systematic regressions — which more likely reflect general kernel behavior rather than scaling or platform-specific effects.
After analysis and severity classification, all confirmed regressions are grouped by benchmark, test, operation, metric, and experiment pair. For each group, the system checks how many concurrency levels show consistent degradation. If regressions are present across all expected levels (e.g. 1, 4, 8, 16, 32, etc.), the case is flagged as systematic.
This filtering is based on a simple principle: a regression that consistently degrades performance at every level of concurrency is unlikely to be a fluke or tuning issue. Instead, it suggests a fundamental problem in the kernel behavior under test.
Systematic cases are ranked by severity and consistency score, and passed downstream as high-confidence candidates for follow-up investigation or bisection. This step ensures that engineering effort focuses on issues with the clearest and broadest impact.
Here is sample output of this step:
wis/futex3/futex3-threads[futex3 ops]
  Kernels: v6.16 → v6.17-rc2
  Experiments: 8472f8a828861511 vs 21e588a36c7405a9
  Concurrency lvls affected: 10 (2, 5, 8, 12, 21, 30, 48, 79, 110, 128)
  Severity: RED: 10
  Avg Score: 87.5
  Median diffs: [-12.45% to -11.36%]
wis/futex3/futex3-threads[futex3 ops]
  Kernels: v6.16 → v6.17-rc6
  Experiments: 8472f8a828861511 vs 147689cb3269380f
  Concurrency lvls affected: 10 (2, 5, 8, 12, 21, 30, 48, 79, 110, 128)
  Severity: RED: 10
  Avg Score: 87.5
  Median diffs: [-12.39% to -11.15%]
Visualization
Once regression signals are classified, they must be accessible to users in a way that supports triage, prioritization, and exploration. The visualization layer serves this purpose by providing structured and navigable views of performance findings—from high-level summaries down to individual measurements.
The primary visualization tool is Percolator, which is a custom-build multi–page Dash application. It organizes the data into multiple levels:
- Kernel-level summary: Aggregated view showing the overall regression status per kernel version or experiment group.
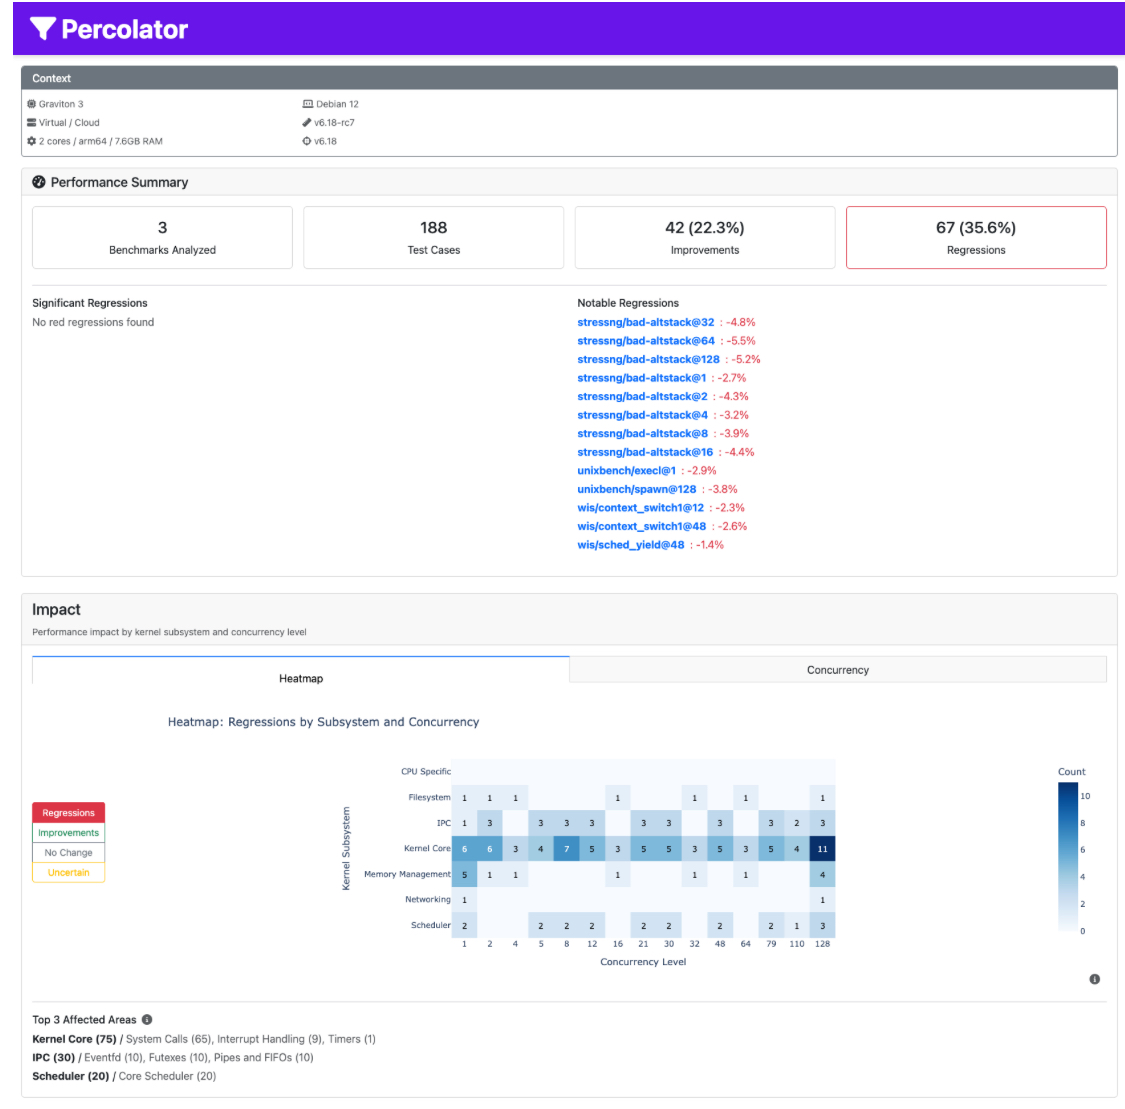
- Benchmark suite overview: Breakdown of regressions and improvements by suite (e.g., stress-ng, unixbench).
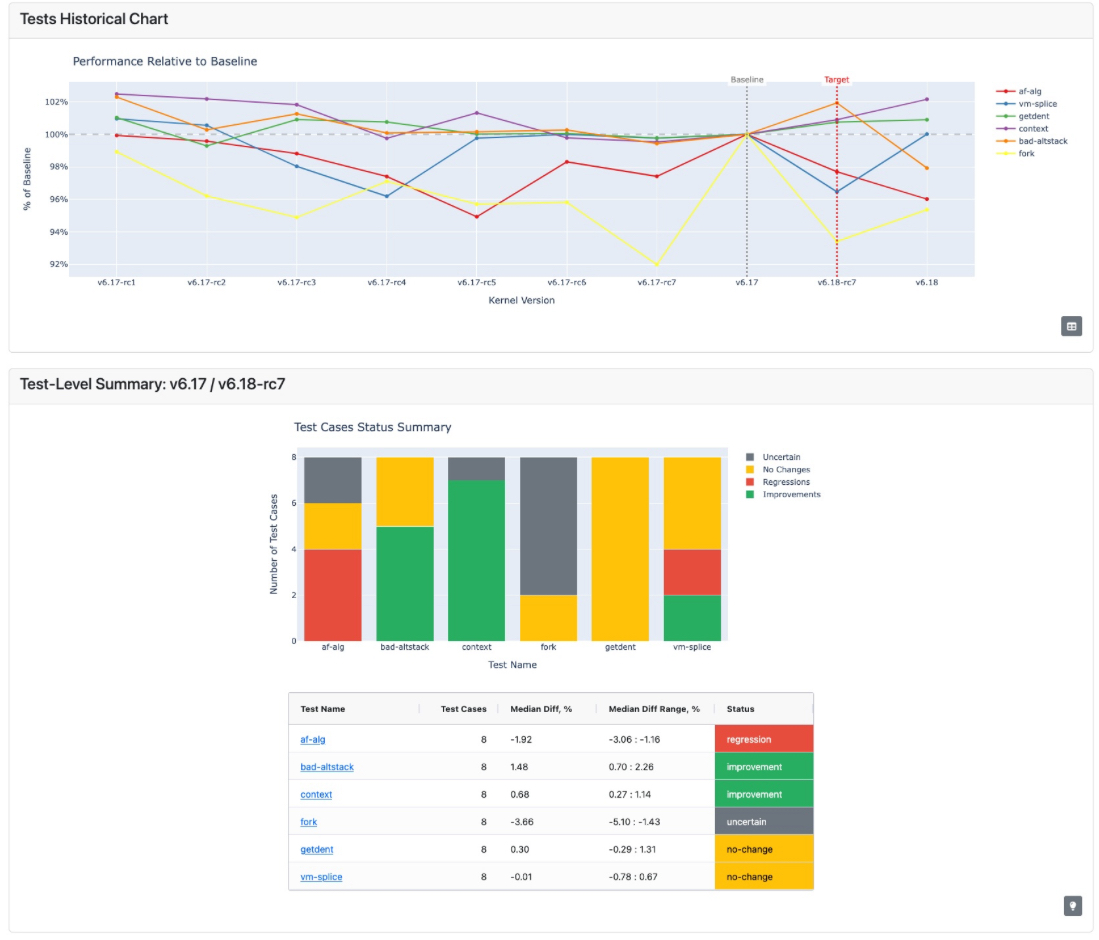
- Test-level drilldown: Detailed view of each test-operation-metric combination, with effect sizes, confidence levels, and trend plots.
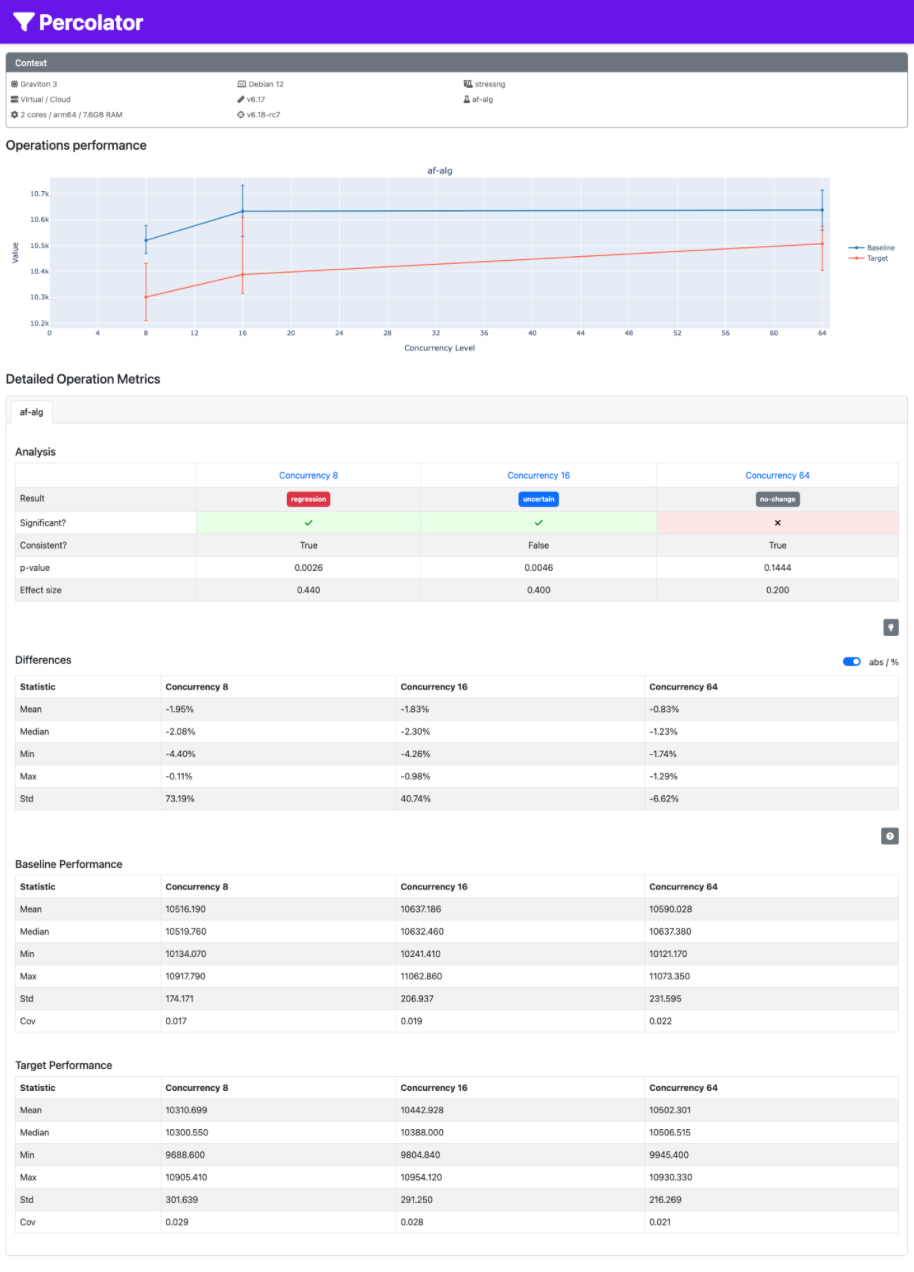
- Instance-level comparison: Direct comparison of raw benchmark outputs, logs, and environment metadata between baseline and target.
Each page links directly to the source experiment artifacts, preserving traceability to the original kernel, config, and benchmark data.
Next Steps
From there, the workflow continues with engineer review and triage: high-confidence cases can be prioritized for commit-level bisection and, when confirmed, reported upstream for further investigation and resolution. We’ll cover this in future posts.
How Linaro Can Help
Reliable kernel performance testing requires more than running benchmarks, it requires reproducible experiments and trustworthy analysis. Linaro combines automated execution, controlled experiments design, statistical analysis and systematic regression detection. If you run Linux on arm64-based cloud, datacenter or lab infrastructure, Linaro can help build a reliable testing and regression detection system to identify and prioritize issues before they reach your production environment or customers. Our approach can be adapted for upstream release validation and downstream kernel maintenance.
Interested in working with the engineers behind these upstream improvements? Contact Linaro to discuss how we can help accelerate your Linux platform development.
About the author
Konstantin specialises in automation across backend systems, infrastructure, data processing, testing and performance evaluation, with practical experience in Linux kernel benchmarking and regression analysis. He develops systems that automate engineering workflows and data analysis, and support regression investigation and root cause analysis. He also applies modern AI tools to accelerate analysis, streamline workflows and improve related processes.