I like sleep. Sleep is good. With plenty of sleep I address the day with vigor, and approach the duties of the day with zeal. So, when I discovered how to debug while I slept I was excited and I think that you will be excited too.
How to debug offline with Linaro DDT
Linaro DDT enables you to debug while you sleep using offline debugging. Offline debugging provides the complete breadth of DDT debugging capabilities but without user interaction and without using the GUI. You run your application as usual either through your batch system or directly, and instead of interacting with the GUI DDT will generate a report upon completion of your job. Download documentation for offline debugging.
You can control offline debugging with command line arguments and by providing a session file. Specifying breakpoints, watchpoints, and tracepoints on the command line can be very useful when you are scripting many runs for a parameter type diagnosis or setting up offline debug results as part of your regression testing. It can be simpler and more expedient, however, to create a session file that specifies the features that you want. So, let’s start up DDT and create a session file.
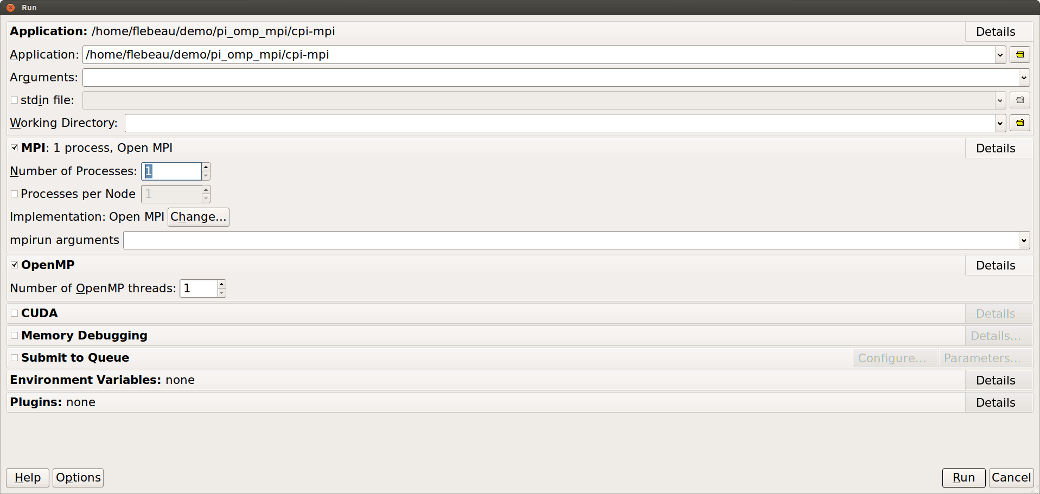
For this illustration I am going to use a simple example that uses OpenMP and MPI to parallelize the calculation of pi. At this point we are just using the user interface to generate a session file, we are not really running in earnest, so I will start with one thread and one MPI process. When we go to submit the job for debugging you can run in a different configuration, typically much larger scale. For my first run I want to set a breakpoint right after all the MPI setup boiler plate and see that everything looks fine.
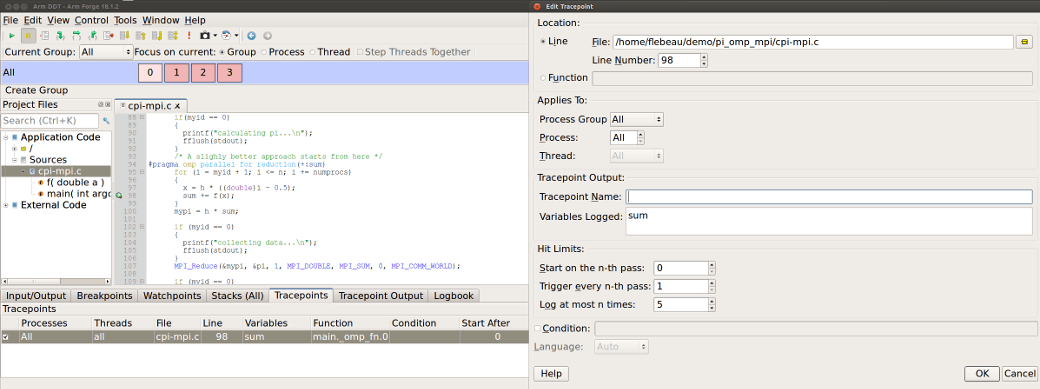
The GUI shows us that we have a breakpoint on line 70. Now I have a loop a little farther down that I want to study. From the following dialog we can see that I am going to output the value of sum on line 98. The number of iterations, n in this loop is rather large so I am only going to log the first five iterations, that should be enough for a first look.
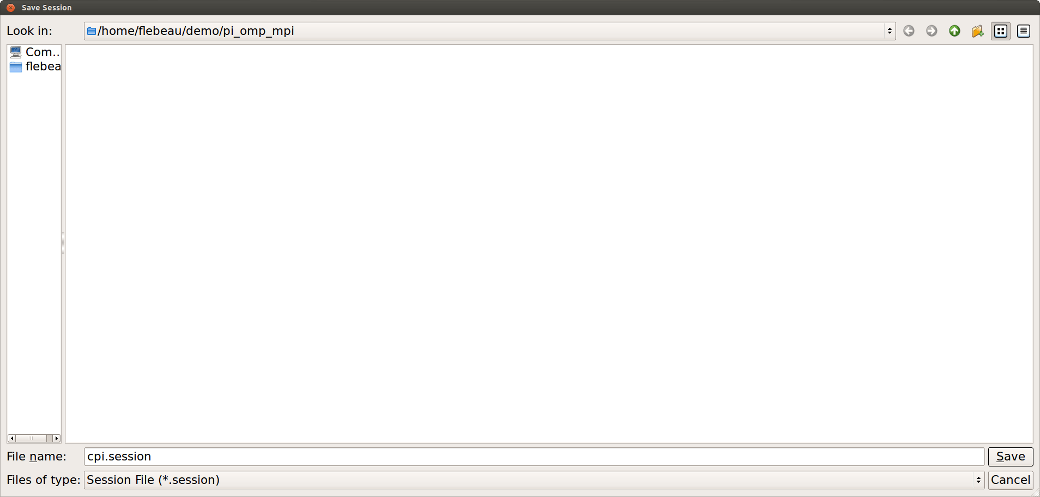
Now let’s save these specifications in a session file. From the File menu select Save Session and provide a file name.
I chose the name cpi.session. This is just a simple xml file that will be provided to DDT to specify the breakpoint and tracepoint we created. Now let’s exit the GUI and submit our offline debugging session.
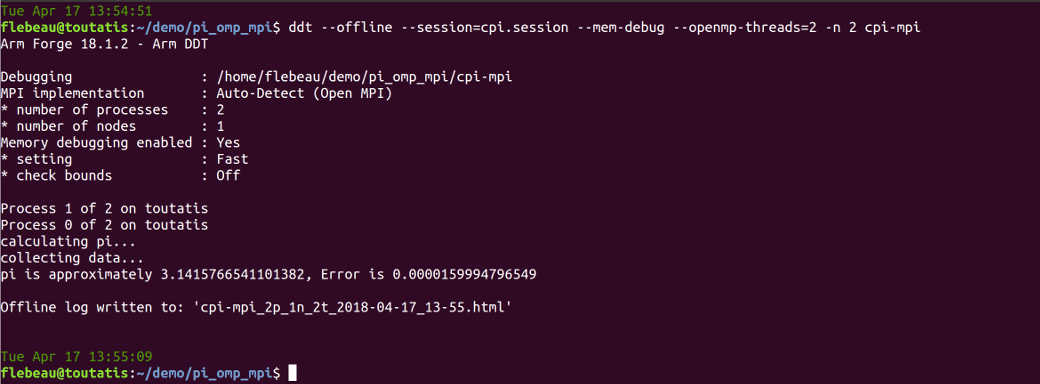
As I did not specify an output file name, DDT chose one for me. Using the –output flag you can specify your own filename. By default, DDT will create the output in HTML format. If, however, you specify a file name that does not have the suffix .htm or .html DDT will create a CSV format file. This is much more compact and amenable to post processing with tools like sed, grep, awk, etc. But, let’s save that for another day and have a look at our output.
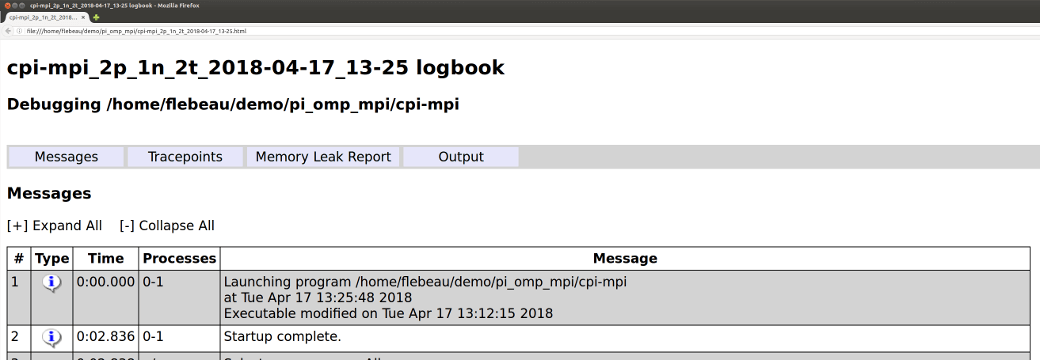
First thing, much like the logbook in DDT, the offline run records the date of your run and build date of the executable. This is good info to help stay organized when working on challenging bugs even if you are getting plenty of sleep. Now let’s scroll down and have a look at what info we got for that breakpoint we set.
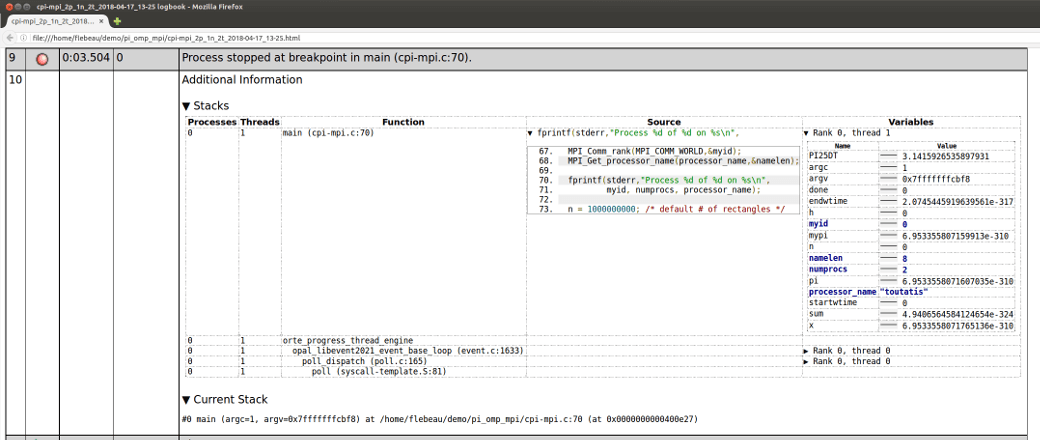
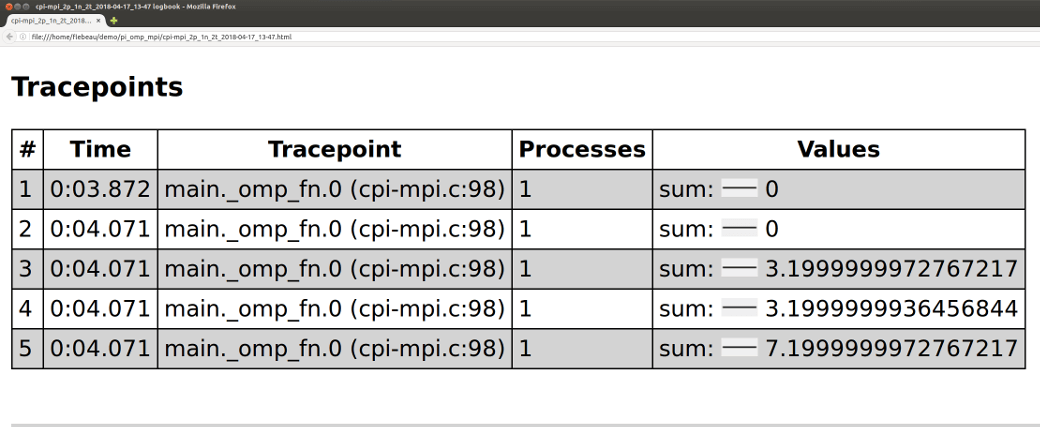
A wealth of information, like the DDT GUI. A snapshot of the current stack and view of all the variables with sparklines to show their values across processes. And, scrolling down to the sparklines section of the output we can see the tracepoint showing the sparkline and min max values for the variable sum for the first five iterations of the loop.
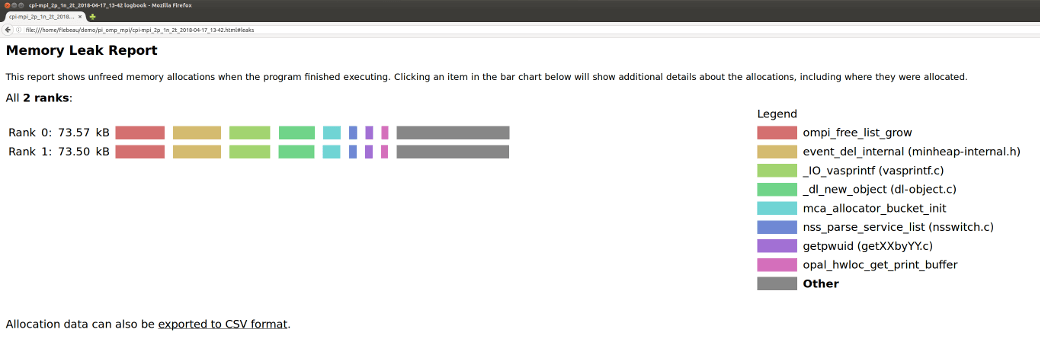
Memory debugging was enabled in our run with the –mem-debug flag. We don’t suspect any memory leaks in this code, but it is usually easier to fix those types of problems sooner rather than later, so it is good practice to always enable memory debugging. The overhead of the default usage of memory debugging in DDT is very low and you are probably sleeping when your offline run executes, so why not!
And, continuing to the bottom of the output we get the actual output of our run.
This post has been a whirlwind overview of just one of the use cases for offline debugging with DDT. I invite you to visit the documentation reference below to investigate many of the other ways to take advantage of offline debugging.


