


Introduction
Memory debugging is a critical part of the development lifecycle for memory-intensive applications. Undetected memory issues can lead to performance bottlenecks, unpredictable behaviour, or even application crashes. In this post, we’ll explore how Linaro DDT’s advanced memory debugging capabilities help uncover and isolate memory bugs in both serial and parallel code, whether you’re working on a single processor or across many. Our goal is to equip you with the knowledge and tools to seamlessly integrate memory debugging into your workflow—resulting in faster, more reliable, and predictable code.
Basics of memory debugging
Effective memory debugging starts with understanding how your programming language manages memory. Different languages offer different levels of abstraction and automatic memory management. For instance, languages like C and C++ require manual memory management, while languages like Java and Python manage memory through garbage collection. A basic understanding of concepts such as memory allocation, pointers, and garbage collection mechanisms is paramount for effectively managing the memory usage of your application. In addition, knowing how to use memory debugging tools specific to your environment can give you a significant advantage in identifying and resolving memory issues early in the development cycle.
When it comes to memory management, developers often encounter a few typical issues:
-
Memory leaks, where the application fails to release memory it no longer needs, leading to reduced available memory over time.
-
Memory corruption, which occurs when the program writes data outside the boundaries of allocated memory, potentially overwriting other data.
-
Fragmentation, where memory is used inefficiently, leaving unused gaps in memory.
-
Improper deallocation, memory that is not released correctly or at the right time, causing leaks or corruption.
Memory debugging with Linaro DDT
Linaro DDT’s memory debugging feature intercepts calls to the system memory allocation library, recording memory usage, and confirming correct usage of the library by performing heap and bounds checking. This mechanism enables Linaro DDT to perform memory debugging activities across languages such C, C++, Fortran and Python codes. With Python codes however, memory debugging is done within the underlying native / interpreter code (Typically C code) and not on the Python language itself. This still provides insights into where large chunks of memory were allocated and held.
Memory debugging with Linaro DDT is cross platform across all major Linux distributions, enabling you to learn a tool once and apply the memory debugging capabilities across a variety of Linux platforms.
By default, memory debugging with Linaro DDT is not enabled. The feature can be enabled by selecting the memory debugging checkbox in the run dialog. The memory debugging options enable you to tailor the memory debugging capabilities towards a range of memory issues, examples of these are given as we progress through this blog.
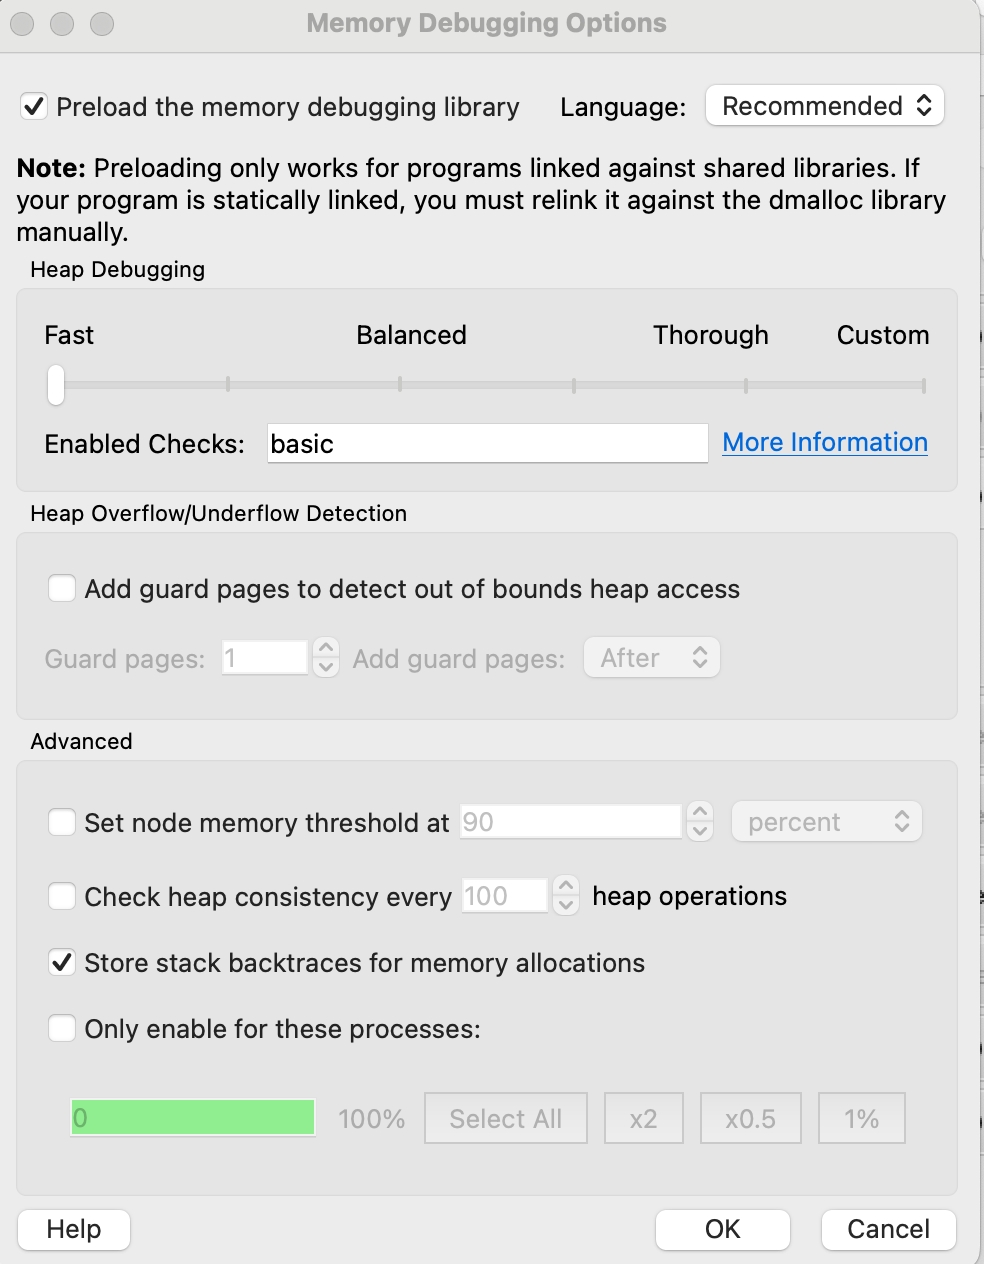
Memory Debugging Options
Heap debugging
Heap debugging focuses on monitoring and analyzing the dynamic allocation and deallocation of memory on the heap during the runtime of a program. Heap corruption detection allows you to detect various types of heap memory errors, such as:
-
Out-of-bound writes & buffer overflows
-
Writes to freed memory
-
Reads from freed memory
When memory debugging is enabled with the default options, trivial bugs on the heap will be detected and Linaro DDT will halt at the specific location that triggered the memory error.
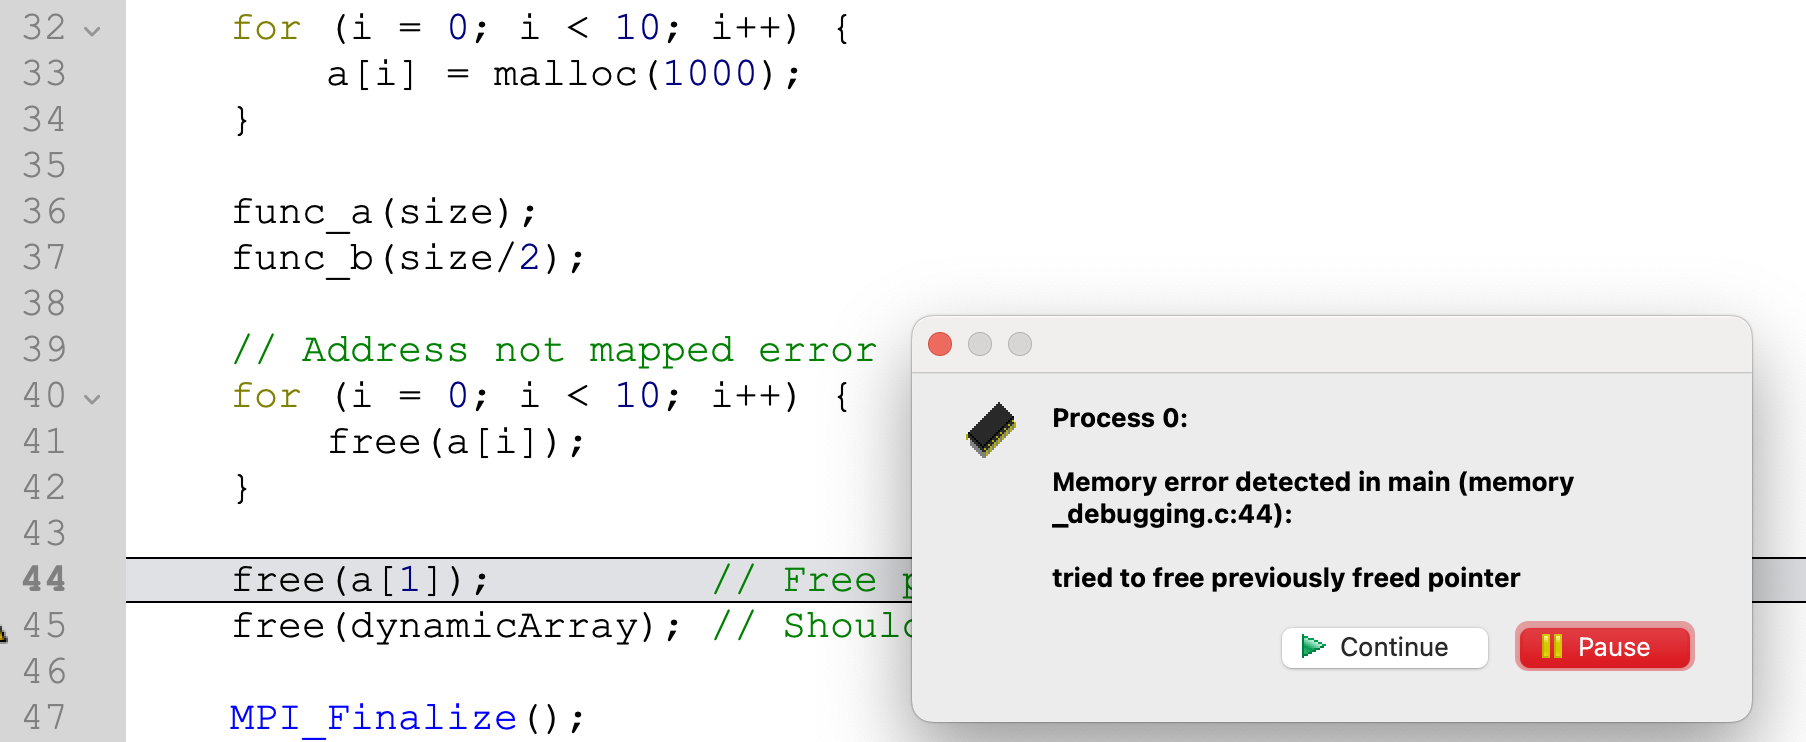
Free Pointer Twice
If the above code was executed without Linaro DDT, it would crash with no clear reason of what has happened. By running the application with DDT attached, the application halts at line 44. The error message is intuitive enough to determine that the pointer was already freed previously (at line 41) and therefore it cannot be freed again.
There are however heap memory errors that are more difficult to detect. These types of memory errors can be detected using the Heap Debugging slider within the memory debugging dialog. In practice, setting the slider to Balanced is still fast enough to use and will catch most heap memory errors. If you come across a memory error that is difficult to pin down, choosing Thorough might expose the problem earlier, but you will need to be very patient for large, memory intensive programs.
One way to reduce overhead is by selecting only enable for these processors in the memory debugging dialog and then entering the range of processors to track memory against. This is useful for applications that are running at very large scales and the memory error can be isolated to a specific range of processors.
Detecting Stack allocation issues
Once the debugger halts due to a memory error, then various debugging features can be used to drill down into potential causes of the memory error. For example, as shown above, a[10] is initialised, resulting in more elements within a being accessed than allocated. This can be seen by comparing where the memory error occurred with the information in the code viewer and the variables window to inspect the variable a.
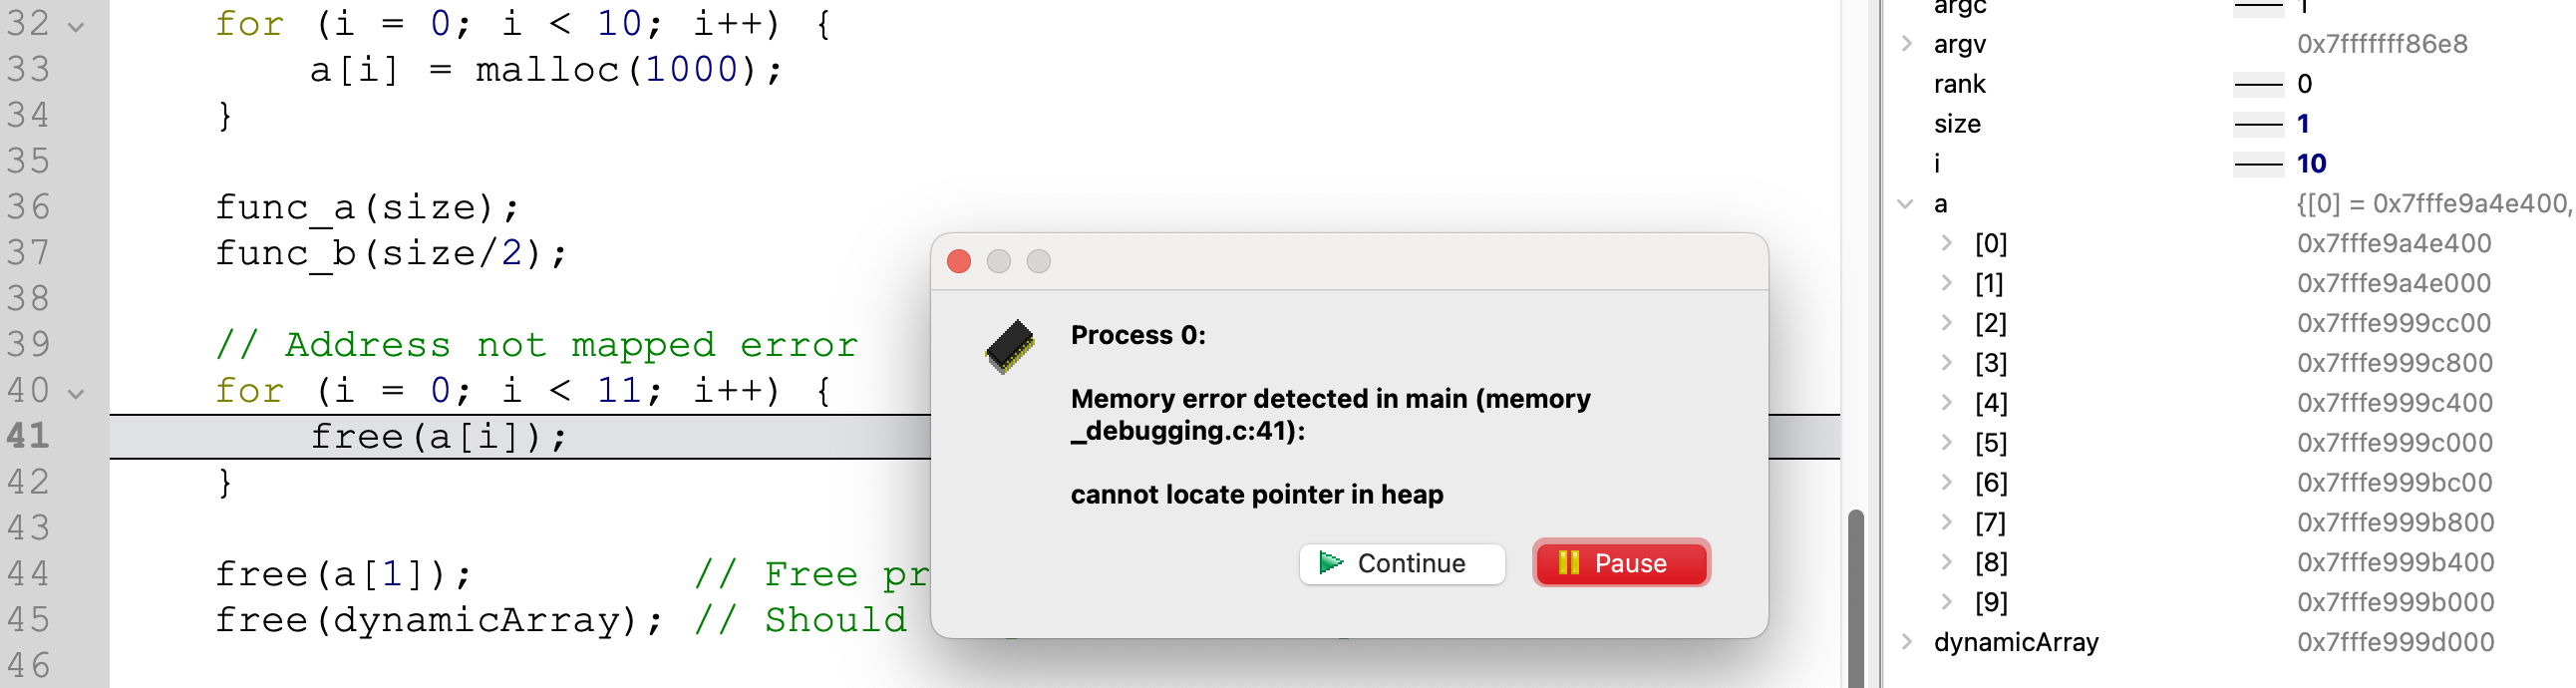
Cannot Locate Pointer in heap
In some cases, the above example may not fail. This occurs if a and dynamicArray are placed on the stack and are laid out as follows:
a[0]
a[1]
…
a[8]
a[9]
dynamicArray
Arrays in C use pointer arithmetic to address individual elements, this means that element a + 10 could potentially be dynamicArray on the stack. DDT can be used in this case to inspect a with the Pointer Details to determine that a[10] is pointing to the address of dynamicArray.
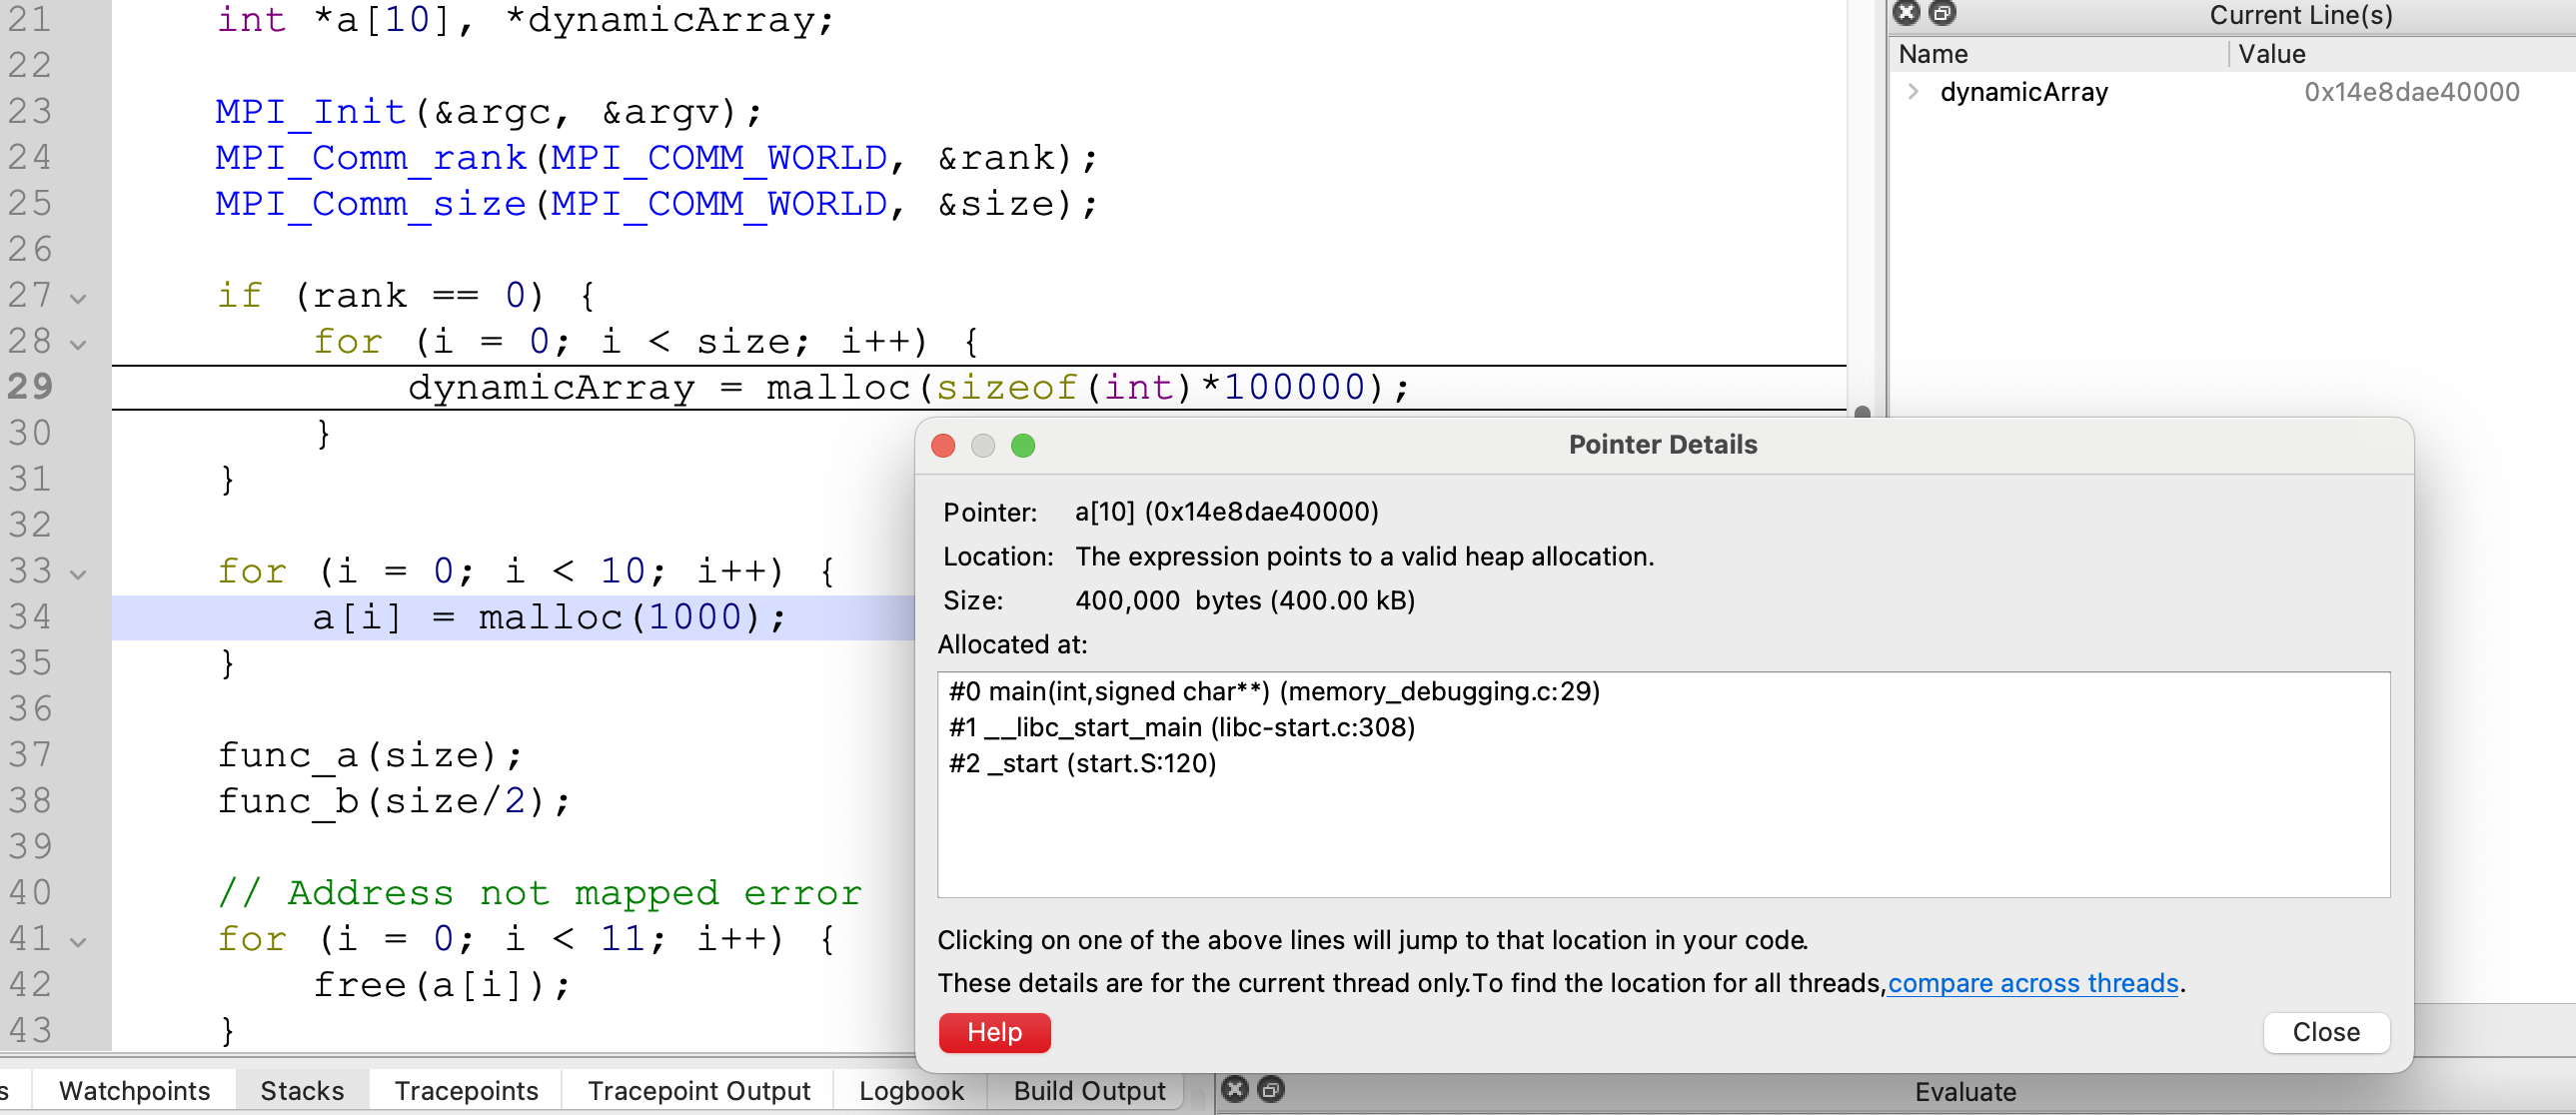
Pointer Details
Memory leak detection
Memory leaks occur when a program fails to release memory that is no longer in use, leading to a gradual decrease in available memory. One of the most effective strategies to reduce the risk of memory leaks is to fix any memory allocation related warnings that are reported by static analysis tools.
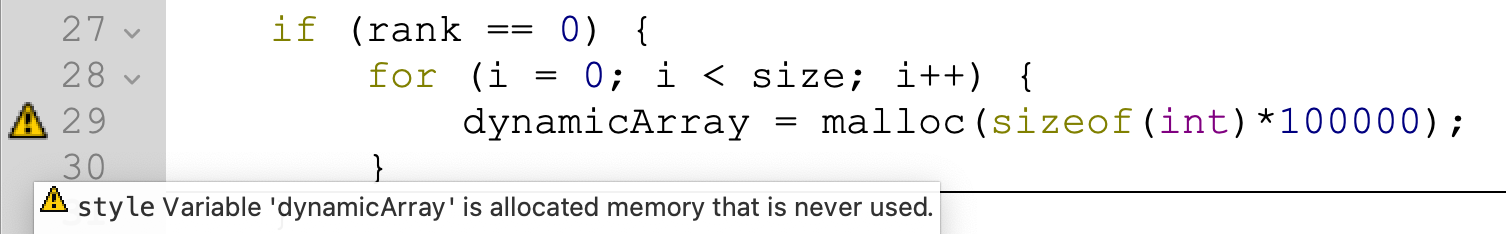
Allocated memory not used
Linaro DDT will report on allocated memory issues, even without memory debugging being enabled. Allowing your code to be analysed for memory allocation issues without needing to run the code to a specific line.
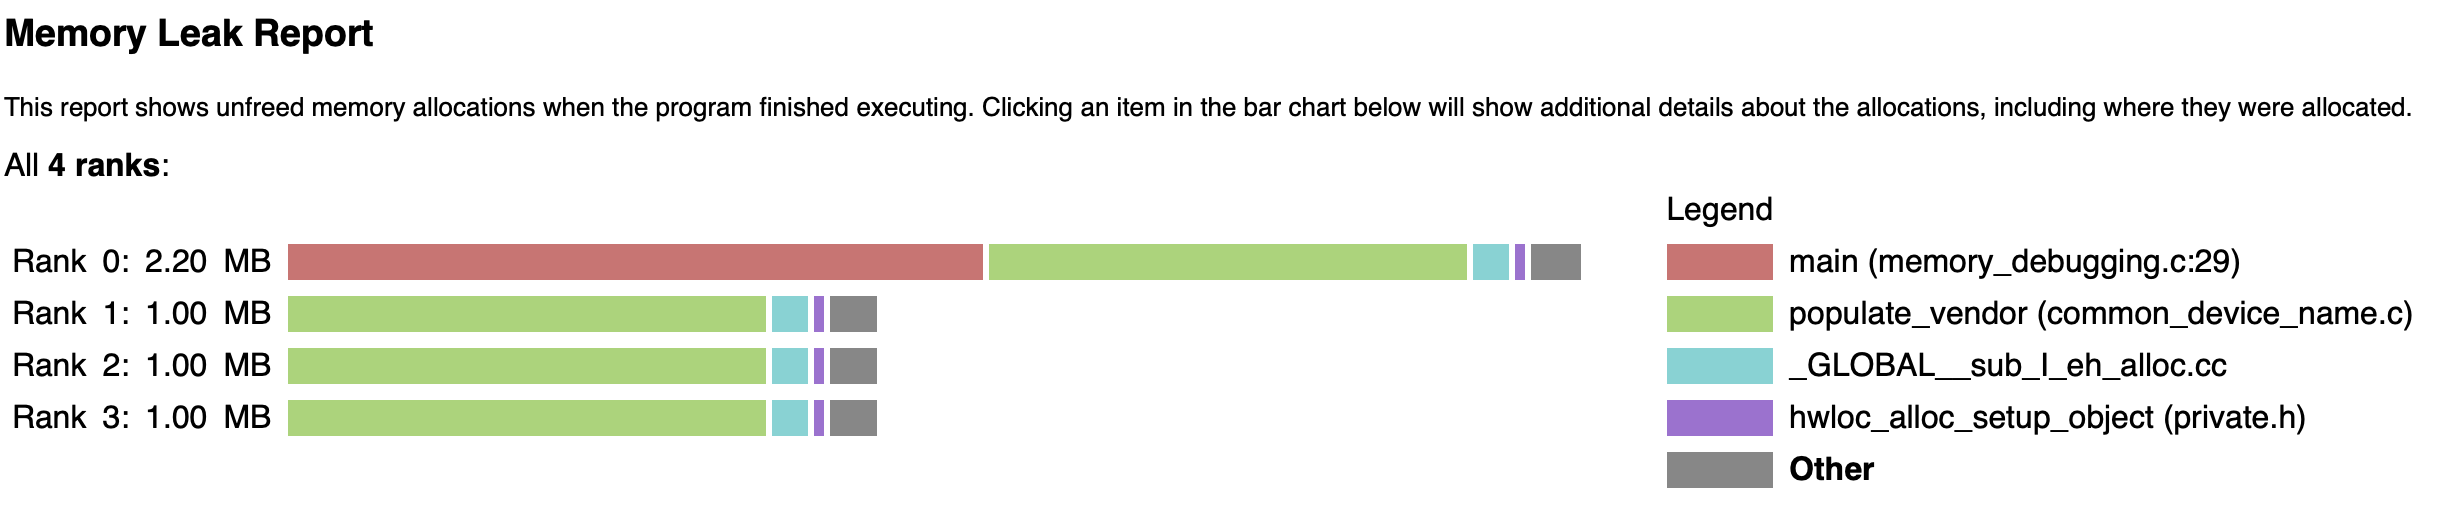
To obtain a quick first-look at memory allocations, a Memory Leak Report can be generated in offline mode to display a graphical report of the largest memory allocations that were not freed by the end of the program.
To generate a Memory Leak Report, the following ddt offline command can be run.
ddt --offline --mem-debug mpiexec -n 4 ./memory_debugging
This generates a report which indicates that memory allocated on memory_debugging.c:29 was not freed for Rank 0.
Memory leak report
The Memory Statistics dialog can be used to obtain a view of the total memory used across processes. The processes using the most amount of memory are displayed in size order which is useful for checking that the application has released large amounts of memory that is no longer in use. The Memory Statistics dialog displays the total amount of memory allocated and freed since the program began, the current number of allocated bytes, and the number of calls to allocation and free routines. These memory statistics enables typical memory leaks to be detected.
The currently allocated memory in your application can be visualised using Linaro DDT’s Current Memory Usage dialog. This provides a view to see how memory is distributed across processes at the point where the debugger has halted the execution.
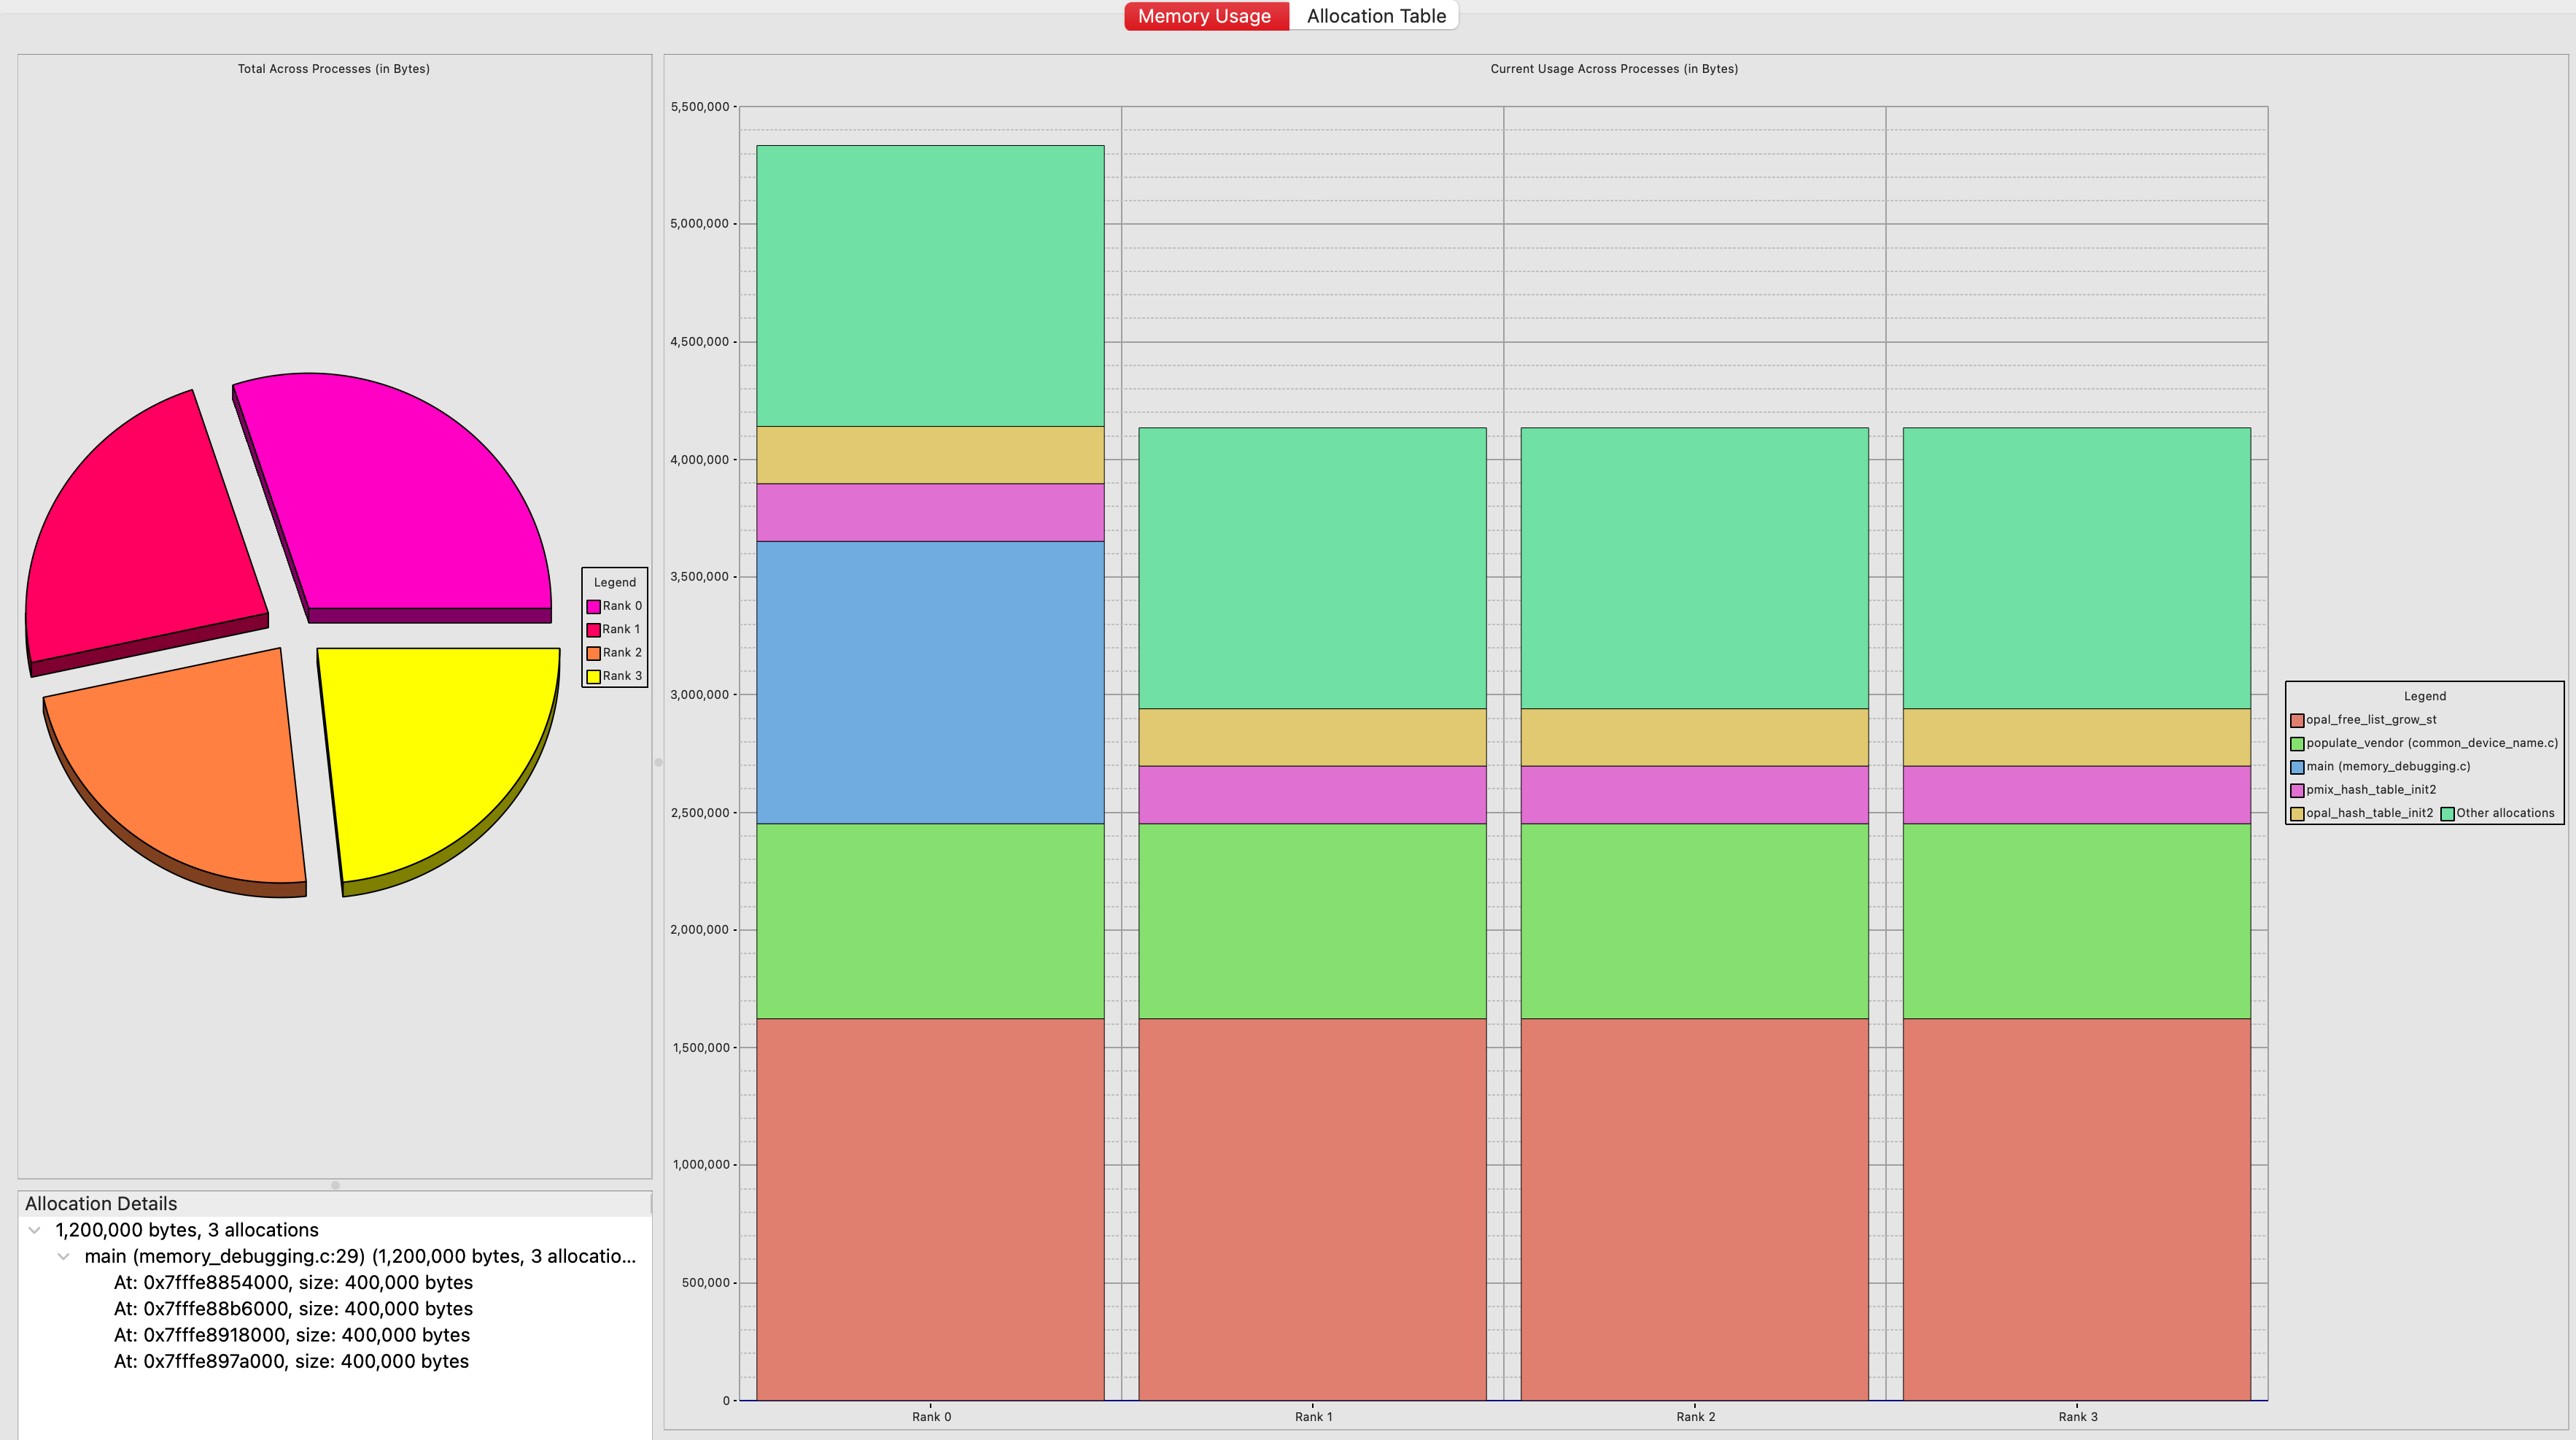
Memory usage distributed across processes
The outlier in the above example shows that Rank 0 has allocated more memory than all other ranks and this is due to memory_debugging.c:29 completing 3 allocations of 400kb each. Looking back on the Allocated memory not used code snippet, memory_debugging.c:29 is allocating memory for Rank 0 which is never used. The Current Memory Usage dialog therefore enables memory anomalies to be spotted and related back to the code where the anomaly occurred.
Performance analysis tools can also be used to detect memory leaks and go a step further by not only pinpointing memory issues but also providing insights into CPU usage and other crucial performance metrics. Performance tools, like Linaro MAP, offer a graphical representation of memory usage over time, making it easier to spot unexpected high memory usage during different application phases.
Memory corruption analysis
Memory corruption happens when a program writes data to a region of memory outside the bounds of its intended allocation. This can lead to crashes, unexpected behaviour, or security vulnerabilities. Persistent but random crashes caused by access of memory beyond the bounds of an allocation block can be diagnosed using the Guard Pages feature within the Memory Debugging options dialog.
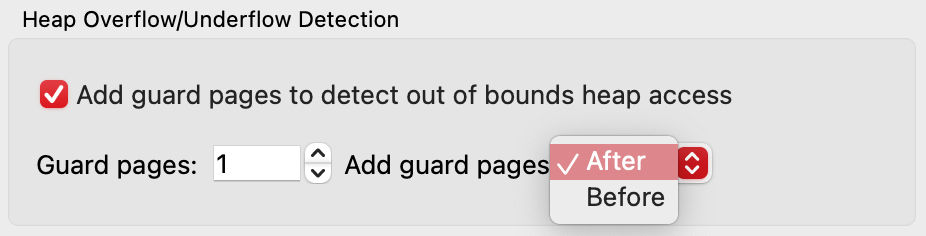
Guard Pages
Any attempts to read or write to the specified number of pages before or after the block will cause a segmentation violation that stops your program. Add the guard pages after the block to detect heap overflows, or before to detect heap underflows.
Tools like AddressSanitizer can dynamically detect buffer overflows, use-after-free errors, and other corruption patterns, highlighting the precise location in the code where the corruption occurs. Linaro DDT supports AddressSanitizer through a plugin.
GPU memory debugging
Currently, Linaro DDT supports some memory debugging capabilities on Nvidia GPUs. Both CPU and GPU memory can be debugged concurrently, see CUDA memory debugging for further information on CUDA memory debugging on Nvidia GPUs.
Memory threshold detection
Running out of memory often causes your application to be killed instantly with no further debugging or diagnostic information. Node memory threshold detection can be used to detect out of memory errors early by setting a memory threshold within the memory debugging dialog.
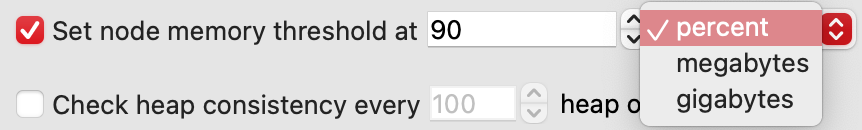
Set a memory threshold
Linaro DDT will report an over node memory threshold limit error as soon as a dynamic memory allocation (such as malloc or ALLOCATE) takes the total memory usage over the specified threshold. When this error is reported, you have the option to continue playing the program, or to pause the execution.
This option is useful to set as a precautionary measure if you suspect your code could hit an OOM killer. Linaro DDT will halt the execution before the OOM killer is triggered which will enable you to inspect the memory allocations and memory usage of the application to identify where the memory is being used.
Additional tips for efficient memory management
Memory debugging can be a complex task, but certain practices can make the process more efficient. Firstly, adopting a proactive approach to memory management, such as using smart pointers in C++, can significantly reduce the risk of memory leaks. Use static analysis to scan the code for memory issues and ensuring that all errors and warning are fixed before executing code. Incremental testing, where code is tested in small, manageable chunks, can also help in identifying memory issues early in the development cycle. Lastly, utilizing breakpoints within a debug session can offer invaluable insights into the state of the application at various execution points.
Memory optimization involves more than just fixing leaks; it requires a comprehensive approach to reduce overall memory usage and improve application performance. Effective strategies include minimizing the use of global variables, optimizing data structures, and implementing caching mechanisms where appropriate. Additionally, reviewing and refactoring code to eliminate unnecessary memory allocations can result in significant performance gains. It’s also beneficial to leverage compiler optimizations and profiling tools to identify bottlenecks within the code.
Final thoughts
Memory debugging is not a one-time task. It’s an ongoing process that plays a vital role in the performance and reliability of software applications. Regularly dedicating time to review and optimize memory usage ensures that your application is performant, reliable and predictable. Familiarizing yourself with the debugging tools and their features before diving into the debugging process saves time and effort. By mastering these techniques and using the appropriate tools, developers can ensure their applications run efficiently and reliably, offering a better experience for users and reducing the time and cost associated with memory-related issues.
Download the latest Linaro Forge.