

If you work in the Rocky Mountain region and you can spell HPC, you have probably heard of the Rocky Mountain Advanced Computing Consortium (RMACC) HPC Symposium. This is an excellent conference that provides an intimate environment for connecting with colleagues and always has a rich agenda with content for attendees ranging from students to veteran practitioners. At this year’s event I had the opportunity to present on debugging methodology. Preparing for this event reminded me of the importance of good methodology so I want to revisit and continue the topic here. The state of debugging tools has advanced dramatically since your grandma first entered a write(,) statement in her code deck but unfortunately the adoption of best practices in debugging still has room for improvement.
Methodology First
When’s the last time you sat down and said you are going to invest a few weeks investigating a software bug?, … yeah, me too. More than most aspects of software construction, debugging times are often underestimated. As such we need to apply good methodologies and processes to improve the state of the art. Debugging tool and technique selection is important and we will get to that, but first embrace a methodology. Many bugs are often found from seat of the pants hunches but for repeatable success we need sound processes, techniques and tools.
- Find a process or create your own and make it your guide
- Make a plan, follow the plan, don’t fall in love with the plan
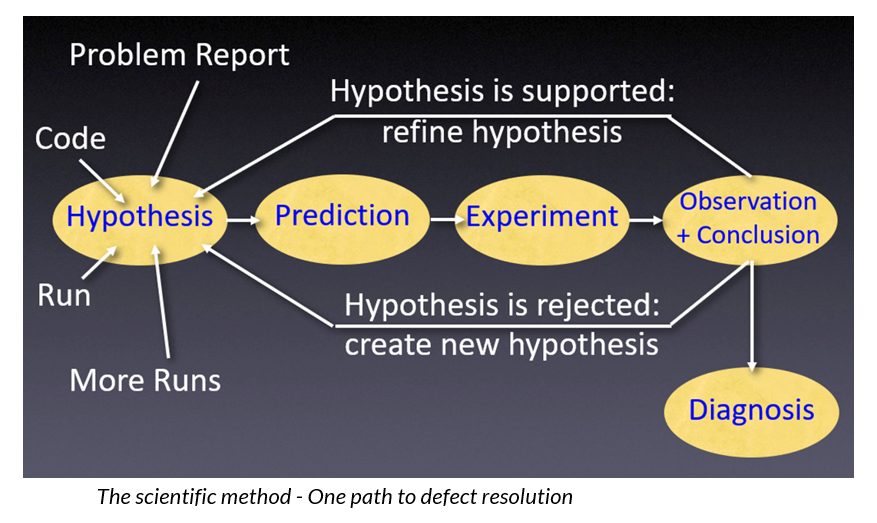
- Get experiMENTAL – Use the scientific method
Define a Process
Many processes for systematic debugging have evolved and these may all have their strengths but the most important is to choose among these and make the process you choose your own. I am a big fan of the book “Why Programs Fail” by Andreas Zeller. I recommend his ‘TRAFFIC’ process.
- Track the problem
- Reproduce the failure
- Automate and simplify the test case
- Find possible infection origins
- Focus on most likely origins
- Isolate the origin of the infection
- Correct the defect
There are tools ranging from simple to sophisticated to support these steps but most important is to follow your selected process even if the process supporting tool is nothing more than your humble notepad.
Adopt Sound Techniques
In HPC I prefer using the scientific method to support steps 4-6 in the TRAFFIC process. Most practitioners in this field come from scientific disciplines, so the technique leverages a well understood technique and has a strong focus on repeatability which is essential for deterministic debugging.
Select and Adopt Tools
Even the maligned print statement if used with a sound methodology can help find challenging bugs but adopting appropriate tools can greatly accelerate your success. I will show some features of Linaro DDT that can support sound debugging methodology. Linaro DDT is part of Linaro Forge which was introduced in our March newsletter. Linaro DDT is a robust, GUI-based debugger that is designed for multi-process multi-threaded HPC applications.
Linaro DDT Highlights
Linaro DDT has myriad features for debugging complex applications but in this article I am focusing on capabilities most relevant in the support of good debugging methodologies.
An Electronic Logbook
Setting up your logbook is the first step in applying the scientific method to debugging. The logbook in DDT logs information about the executable being run, the time and parameters of your run, and the state of your application during execution. The logbook can be saved as an HTML file and stored with other development artifacts. Most importantly the logbook is the place to express your debugging hypotheses and log your experiment. The archived logbooks can be invaluable references as you progress through the investigation of various hypotheses.

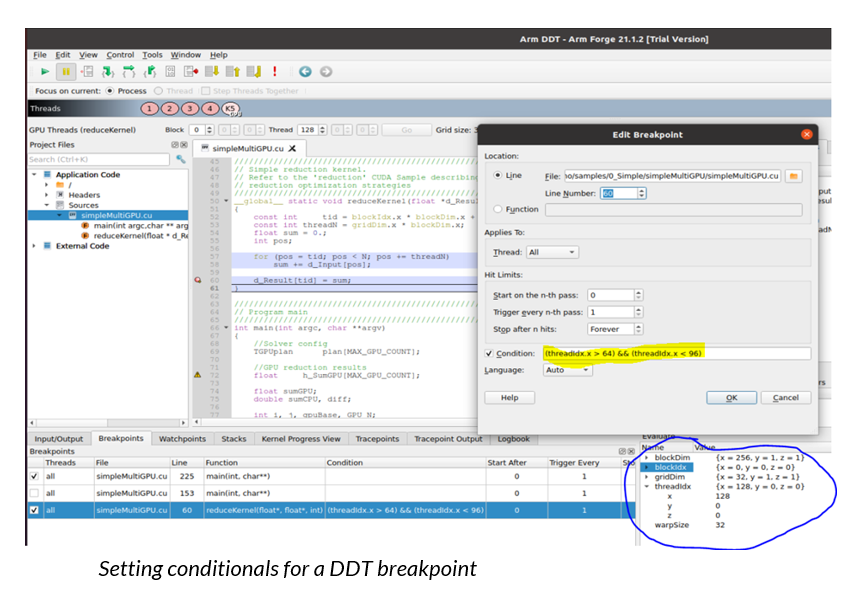
Configurable Breakpoints
A key part of methodical debugging is focusing the range of your search. This limits the quantity of output you need to review and reduces the overhead on your run. This is very easy in DDT with tools to constrict the iterator space and set conditionals.
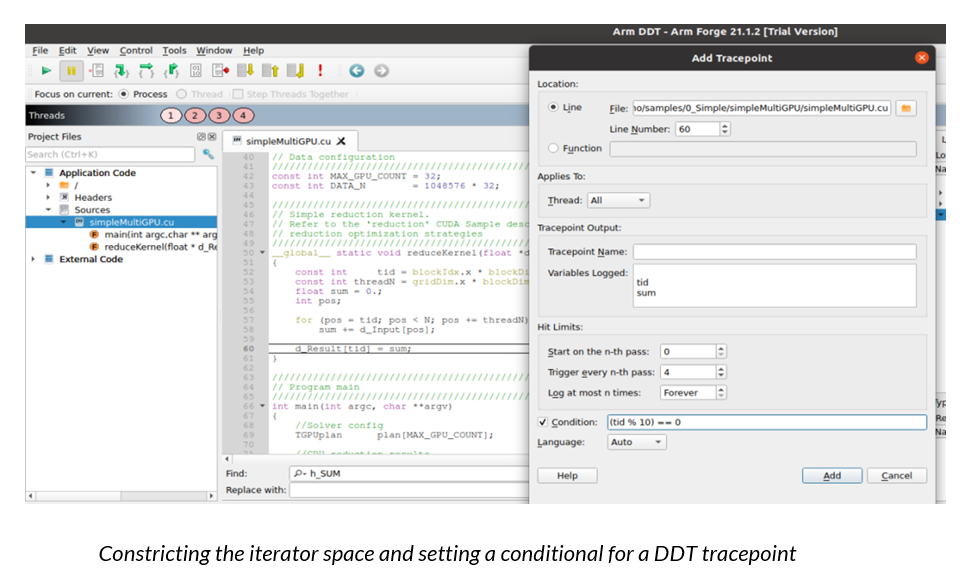
Tracepoints (A Modern print statement)
Tracepoints enable you to output values without rebuilding your program and without the need to re-submit your run. This greatly accelerates the experimentation process and most importantly enables you to output information without changing the state of your program. Since the days of grandma adding write statements to her code the problem of print statements changing determinism has complicated debugging. In HPC codes with many processes this problem can be significantly amplified.
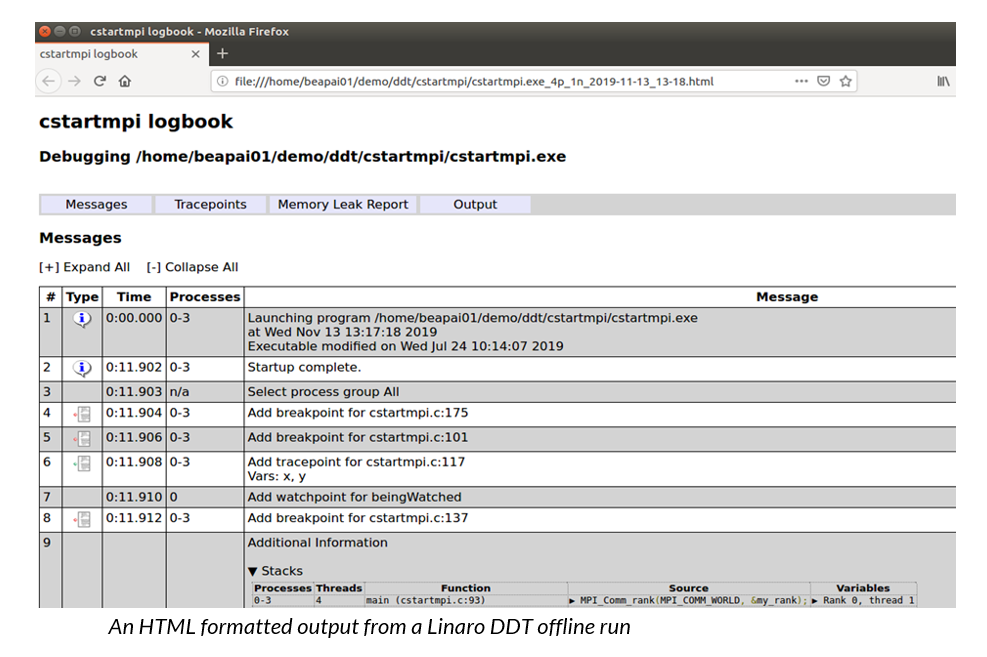
Debugging While You Sleep
Linaro DDT can be run without using the GUI environment. We call this offline mode. In offline mode you submit your job similarly as you would for a production run. It will generate the usual output files, and in addition will generate an HTML or CSV file that logs information about the state of your executable. This method of debugging is invaluable for a broad class of bugs including those that can only be re-produced at large scale, those that take a long run time to reproduce or re-appear in non-deterministic ways.
Continuing the Journey
In this article I focused on adopting a methodology for debugging. I introduced a few of the Linaro DDT features that support that goal but this barely scratches the surface of the debugger’s features. To obtain more information on Forge please visit us at https://www.linaroforge.com. Also, if you would like to schedule an overview presentation of our tools please contact the Forge sales team at sales@forge.linaro.com.