


Time Sensitive Networking (TSN) is a collection of standards defined by IEEE801.2 which address issues like network latency and robustness. In my last blog article , I described the goal of the research Linaro is conducting on the network latency in TSN environment and illustrated the overview of the evaluation method I have adopted along with various virtual network configurations. In this second article of the series, I would like to present more details about necessary setups in the measurement process, and give you the result and analysis based on my experiments against different network bridge technologies.
Please also see my presentation in Linaro Connect.
Test Scenario
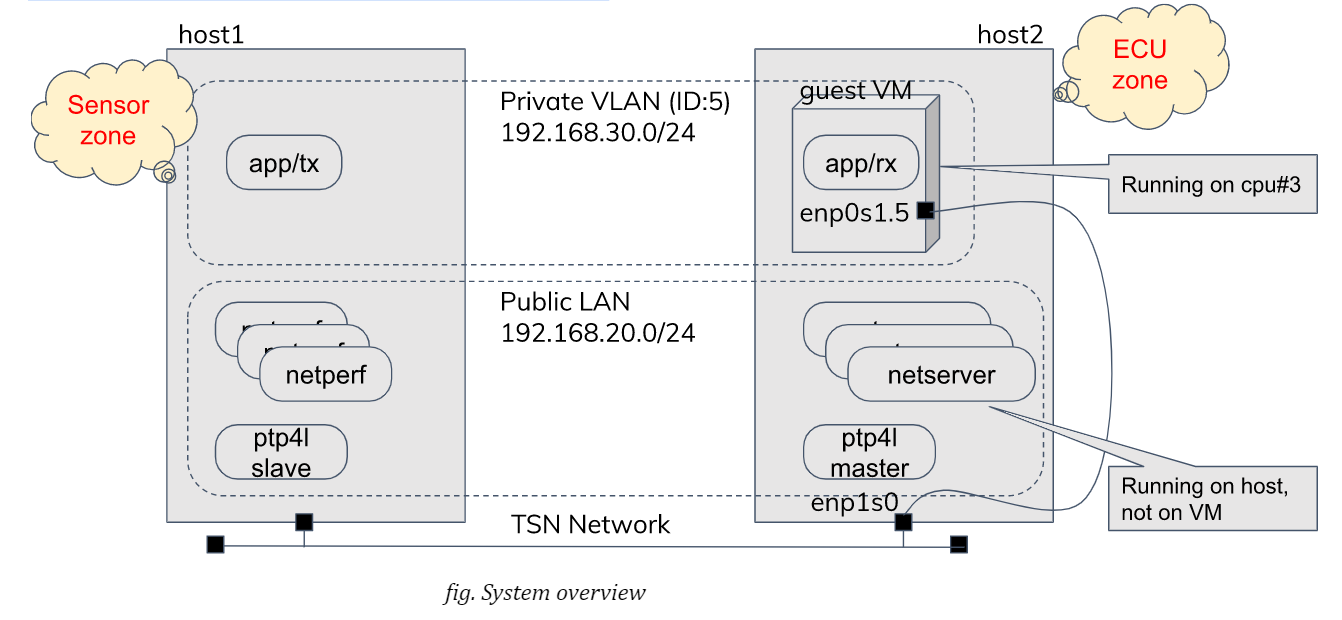
System Overview
A real automotive system is likely much more complicated, consisting of a lot of devices, gateways with a few central servers which are connected with each other via ethernet routers. In my experiments, however, a much simpler system configuration is adopted: Two evaluation boards are directly connected by a cable without using any intermediate switch as our aim here is to evaluate activities at the VM (Virtual Machine) host side.
We use two applications:
A) sample-app-taprio as a time-sensitive application B) netperf (UDP_STREAM test) as network stress workload
The program A comes from Intel developers as a reference code to demonstrate TSN features on their (and possibly other vendor’s TSN-capable) NIC (Network Interface Controller) products and can work as a benchmark test for measuring network latency.
It originally supported only the txtime-assist mode of taprio qdisc combined with hardware-based ETF (Earliest TxTime First) qdisc and, in my experiments, was customised to utilise the full-offload mode.
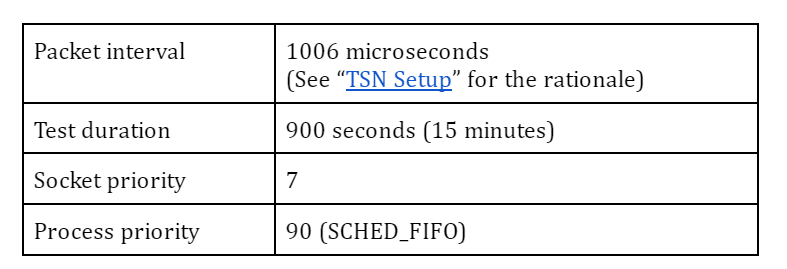
The sender(TX) side simply wakes up at a given interval within a given time slot (see TSN configuration below) and sends out a small test packet. The receiver(RX) side is to poll for incoming packets and calculate a latency based on the difference between the TX timestamp in a packet and the RX timestamp captured by the NIC. Please note that most of the time consumed in a guest OS (Operating System) will be excluded from the definition of latency here because we want to focus on the overhead which comes from the VM host OS (In this sense, the guest OS need not be PREEMPT_RT kernel in the test.)
The sender and the receiver belong to and communicate via a dedicated VLAN (Virtual Local Area Network). While the use of VLAN will expectedly make sense to satisfy QoS (Quality of Service) requirements against multiple applications in a more realistic network, it will have little impact on the behaviors in a simple system configuration like here.
PTP (Precision Time Protocol) Setup
Clock synchronization among the devices and servers over the network is one of key technologies in TSN and the base for all the other features to coordinate activities across nodes in a time-sensitive manner. You need to install a PTP package from the distro (I use linuxptp) and start the daemon before the tests.
While there are many parameters to define PTP’s behavior, I start by using a predefined profile (for automotive use) from the repository. The daemon is assigned to a real-time scheduling class to help improve the responsiveness.
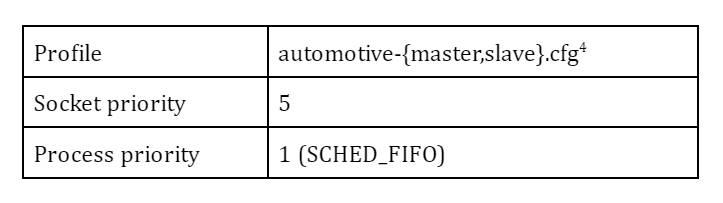
Profile: automotive-{master,slave}.cfg can be found here.
TSN Set up
TSN standard defines a couple of shapers and schedulers; Qav (or Credit-Based Scheduler, CBS) and Qbv (or Time-aware Shaper, TAS) are well known ones. In my experiments, I chose Qbv since the focus here is to ensure that prioritised packets are timely and predictably delivered with some sort of network latency guaranteed over the less prioritised traffic.
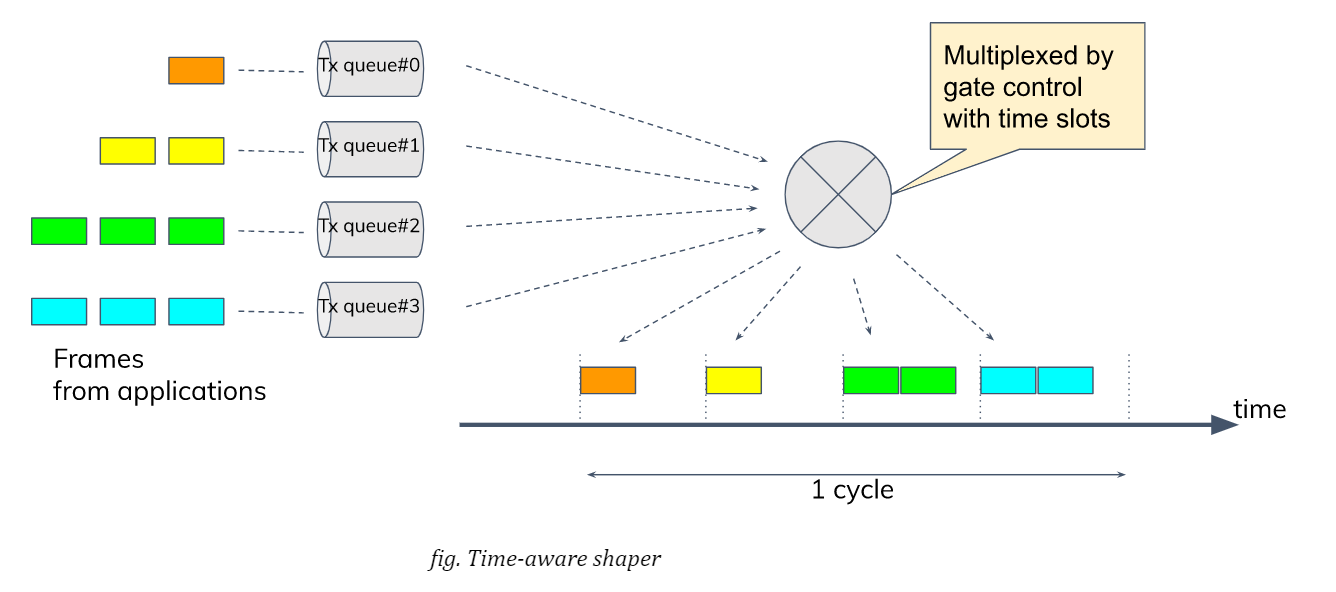
Qbv provides a mechanism of time-multiplexing traffic flows from various applications. More specifically, the network bandwidth is divided into several time slots with constant intervals while all the traffic coming from different applications are set to be classified into different queues or traffic classes. NIC is scheduled to open the gate for allowed TX queues at any time slot so that packets will be allowed to transmit only for the assigned period within a cycle. So the mechanism theoretically assures that the transmission of prioritised packets are not interfered by other (and even excessive) traffic.
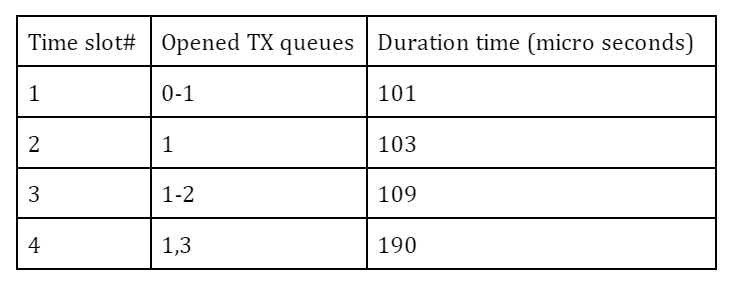
The definition of gate list can vary from system to system depending on applications and their requirements. Here I adopt the configuration in the table below to make streams from the benchmark program and netperf bound to different TX queues, #0 and #3, respectively, while PTP packets are allowed at any slot. So the traffic from the benchmark and the traffic from netperf are not mixed in any single slot and fully isolated from each other to theoretically preclude, at least at hardware level, any traffic collision or congestion at any time.
The duration times (interval) of each time slot may be arbitrary, but these odd (and prime) numbers are chosen not to easily resonate with the kernel tick (4 msec by default).
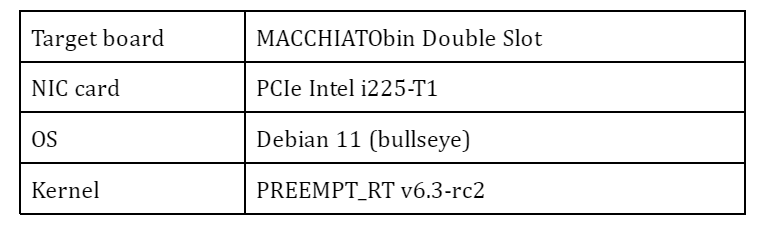
Other Optimisation
On top of TSN (Qbv) scheduler, I found that a couple of additional practices in my experiments are quite effective and should be applied to get better results. Please note that we don’t care about any power management or performance scaling aspect here as our target board (MACCHIATObin) supports neither cpufreq nor cpuidle at the time of writing. In general, it might be a good idea to turn off the power management or performance scaling if you want to optimize for minimal latency.
CPU isolation and affinity
First of all, the guest VM running as a user process on the host is at risk of being preempted at any time by the host OS/hypervisor, which may end up in the process being suspended for an unpredictable period. To avoid this situation, one processor is isolated from the kernel scheduling and the kvm process is bound to the cpu by masking its CPU affinity list.
Furthermore, in the OVS + AF_XDP case, we want to additionally allocate more processors in the isolated-cpu list due to the nature of AF_XDP support. See “e. tap + Open VSwitch with AF_XDP”.
The following parameter in the kernel command line control the isolation:
isolcpus=nohz,domain,managed_irq,3Prioritising kernel threads
It is important to understand how interrupts for received packets are handled in the host kernel and packets are passed by to the guest VM. On PREEMPT_RT kernel, a top-half of a device driver (or hardirq) is executed in a dedicated IRQ (interrupt request) thread and then a bottom-half (or softirq) is executed in a (per-cpu) softirq thread. A softirq may also be directly called in any context where local_bh_enable() is called whatever the context is.
In the bottom-half, a driver usually invokes a NAPI (New API) framework for polling a network port and retrieving packets from a RX queue. Depending on a network device type and its associated packet handler (a bridge function for instance), an appropriate network stack will be called out to determine how a received packet should be processed and where it should be forwarded to.
In the case of vhost-kernel based virtio-net (it is the case in my experiments except OVS+AF_XDP case), this will result in waking up a per-virtio-net vhost thread and notifying it of an arrival of packet. Vhost thread is responsible for injecting a virtual interrupt for the device and kicking up a vcpu (virtual central processing unit) for the kvm process.
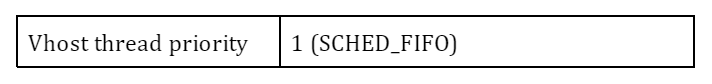
A couple of context switches may take place before a packet finally reaches the guest VM. From the viewpoint of the real-time aspect, we want to manage them carefully to cut short the flow path. While IRQ threads are running under SCHED_FIFO (priority 90), softirq threads and vhost threads belong to SCHED_OTHER (time-sharing class) by default.
That said, my early experiments suggest that the bottom-half code is mostly executed immediately following hardirq, I only put a vhost thread in SCHED_FIFO after starting the guest VM.
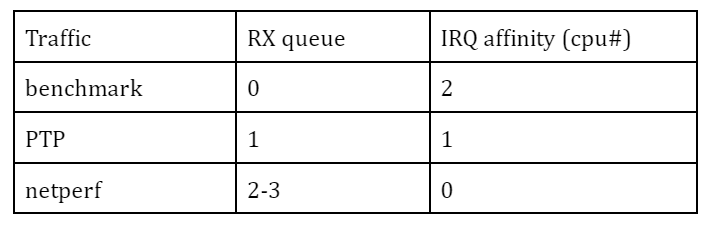
Packet filtering with IRQ affinity
While the network bandwidth is split by time slots using Qbv scheduler, IRQ affinity and RSS (Receive Side Scaling) may help distribute the burden by the kernel stack in packet handling to different processors.
Set up network bridges under virtio
As I mentioned in my previous article, my study covers the following network bridge types:
a. tap (+ kernel bridge) b. macvtap c. XDP-based bridge d. Open VSwitch bridge e. Open VSwitch with AF_XDP
In this section, I describe how I configure the network for each type of technologies and then how I start the guest VM’s in my experiments. I preferred to use primitive command tools rather than using a kind of virtual machine manager like virsh/libvirt so that I can have full control over the test environment.
a. tap + kernel bridge
Create a VLAN port and a bridge device, then attach the port to the bridge:
# ip link add link enp1s0 enp1s0.5 type vlan id 5
# ip addr add 192.168.30.2/24 dev enp1s0.5
# ip link set enp1s0.5 up

# ip link add tmpbr0 type bridge
# ip link set enp1s0.5 master tmpbr0
# ip link set tmpbr0 up
Then start a guest VM, specifying this device at the kvm command line as follows:
# qemu-system-aarch64 -machine virt -cpu host -smp 1 -m 2G ... \
     -netdev tap,br=tmpbr0,id=net0,vhost=on,\
		helper=/usr/lib/qemu/qemu-bridge-helper \
     -device virtio-net-pci,netdev=net0,mac=${MAC_ADDR}
b. macvtap
Create a macvtap device:
# ip link add link enp1s0 name macvtap0 address ${MAC_ADDR} \
      type macvtap mode bridge
# ip link set macvtap0 up
Then start a guest VM, specifying this device at the kvm command line as follows:
# qemu-system-aarch64 -machine virt -cpu host -smp 1 -m 2G ... \
     -netdev tap,id=net0,vhost=on,fd=3 \
     -device virtio-net-pci,netdev=net0,mac=${MAC_ADDR} \
     3<> /dev/tap${TAP_NUM}
c. tap + XDP
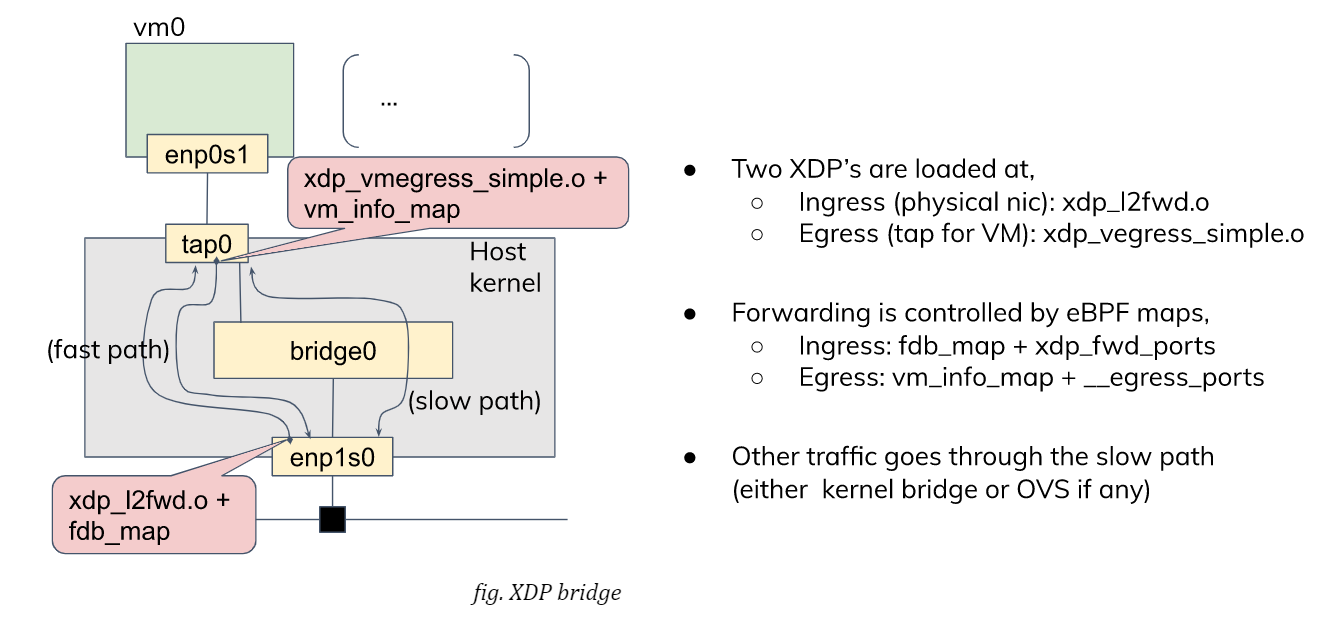
David Ahern has made a very interesting study, in this area. His interest may be in the cloud environment, but his approach can also be applied to embedded systems. Since his sample code is quite useful, I re-use it with a minor change to fit it into my test purpose. There are two XDP (eXpress Data Path) programs, xdp_l2fwd and xdp_vmegress_simple. They are loaded and attached to a physical NIC port and a tap device for the guest VM, respectively. When a packet is to be sent out from the egress port, XDP programs are called out to determine if any action is needed for that packet using their own database (or map in XDP term). If the program returns XDP_REDIRECT, the packet will be directly redirected to another port. If it returns XDP_PASS, the packet will be simply forwarded to the kernel network stack as usual.
If you want to try this case, first download the modified code from my repository and build eBPF programs:
$ git clone -b latency_i225 \
       https://git.linaro.org/people/takahiro.akashi/bpf-progs.git
$ cd bpf-progs
$ make
We use a “tap” configuration as a slow data path and so need to set up the network as in the case of “tap”. After that, we can load and attach two eBPF binaries built above onto, respectively, the physical NIC and the tap device for the guest.
# scripts/l2fwd-simple.shIn the middle of running this script, you will be asked to start a guest VM:
# qemu-system-aarch64 -machine virt -cpu host -smp 1 -m 2G ... \
     -netdev tap,br=tmpbr0,id=net0,vhost=on,\
		helper=/usr/lib/qemu/qemu-bridge-helper \
     -device virtio-net-pci,netdev=net0,mac=${MAC_ADDR}
d. tap + Open VSwitch
You can use the distro’s Open VSwitch package as is. But if you also want to try Open VSwitch + AF_XDP configuration, it’s time for you to compile the code for yourself because AF_XDP support is yet seen as an experimental feature and is not enabled by default. AF_XDP support requires libbpf from ‘tools’ of the linux repository: (See more details in OVS’s Documentation/intro/install/afxdp.rst)
$ cd linux's tools/lib/bpf
$ make
# make install
# make install_headers
Then,
$ git clone https://github.com/openvswitch/ovs
$ cd ovs
$ ./configure --prefix=/ --enable-afxdp --with-dpdk=shared
$ make
# make install
# systemctl start openvswitch-switch.service
Create an OVS bridge device:
# ovs-vsctl add-br tmpovsbr0
# ovs-vsctl add-port tmpovsbr0 enp1s0
# ip link set tmpovsbr0 up
# ip addr add 192.168.20.2/24 dev tmpovsbr0
Then start a guest VM, specifying this device at the kvm command line as follows:
# kvm -machine virt -cpu host -smp 1 -m 2G ... \
     -netdev tap,id=net0,br=tmpovsbr0,vhost=on,\
      script=/somewhere/ifup-ovs.sh,downscript=/somewhere/ifdown-ovs.sh \
     -device virtio-net-pci,netdev=net0,mac=${MAC_ADDR}
Where ifup-ovs.sh looks like:
#!/bin/sh
ovs-vsctl add-port tmpovsbr2 $1
ip link set $1 up
e. tap + Open VSwitch with AF_XDP
AF_XDP support is a kind of extension to Data Plane Development Kit (DPDK) support and the OVS daemon dedicates a userspace thread, called Poll Mode Driver (PMD), for polling a network device and most of the packet processing in the kernel is offloaded to it to improve the network performance. As the thread consumes almost 100% of cpu time, another cpu needs to be isolated from task scheduling. Please add a given cpu number to “isolcpus”, 2 in this example, in the kernel command line before rebooting the system.
First, install Open VSwitch following the instructions mentioned above and then start the OVS daemon with dpdk enabled. We probably need to increase a number of huge pages:
# sysctl -w vm.nr_hugepages=2000
# systemctl start openvswitch-switch.service
# ovs-vsctl --no-wait set Open_vSwitch . other_config:dpdk-init=try
# systemctl restart ovs-vswitchd.service
The next step is to create a bridge device and configure OVS for AF_XDP:
# ovs-vsctl -- add-br tmpovsbr0 -- set Bridge tmpovsbr0 datapath_type=netdev
# ethtool -L enp1s0 combined 3
# vs-vsctl set Open_vSwitch . other_config:pmd-cpu-mask=0x6
# ovs-vsctl add-port tmpovsbr0 enp1s0 -- set interface enp1s0 \
     type="afxdp" option:n_rxq=3 other_config:pmd-rxq-affinity="0:3,1:2"
# ovs-vsctl add-port tmpovsbr0 vhost-user-1 -- set Interface vhost-user-1 \
     type=dpdkvhostuserclient  options:vhost-server-path=/tmp/vhost-user-1

# ip addr add 192.168.20.2/24 dev tmpovsbr0
# ip link set tmpovsbr0 up
Then start a guest VM, specifying this device at the kvm command line as follows:
# kvm -machine virt -cpu host -smp 1 -m 2G ... \
     -chardev socket,id=char1,path=/tmp/vhost-user-1,server \
     -netdev type=vhost-user,id=mynet1,chardev=char1,vhostforce,queues=1 \
     -device virtio-net-pci,mac=${MAC_ADDR},netdev=mynet1,mq=on \
     -object memory-backend-file,id=mem,size=2048M,\
		mem-path=/dev/hugepages,share=on \
     -numa node,memdev=mem -mem-prealloc"
Compare latencies
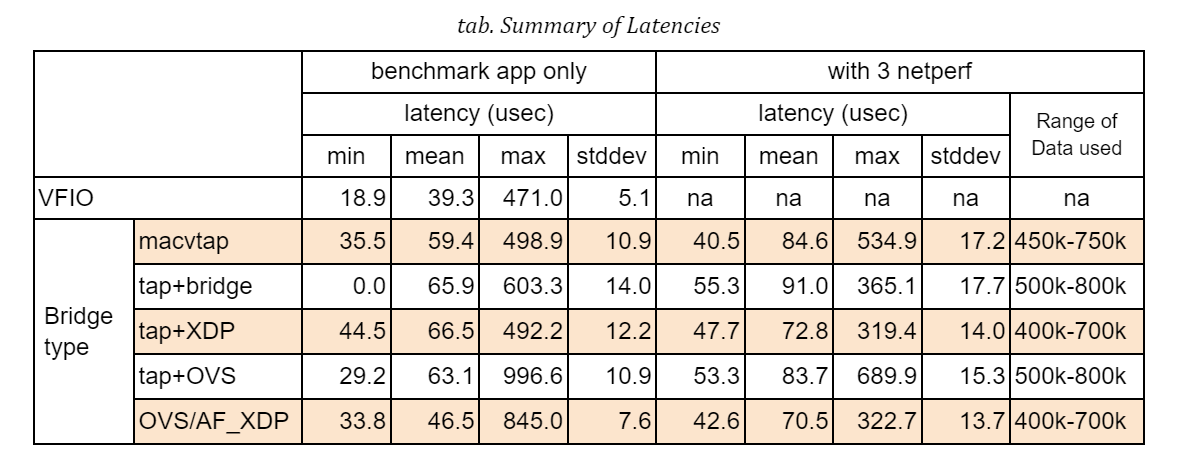
The table below shows the latency statistics for all bridge types. The left column holds latencies in the case where only the benchmark program was executed, and the right column holds latencies when 3 instances of netperf were also run during the measurements.
Those stats are calculated against an arbitrarily chosen range of data recorded in the measurements, that is 5 minutes out of the total 15-minute run, so as to exclude irregular behaviors that will be explained in details below. You will notice that some result graphs below suggest that a couple of big spikes of latency may happen or latencies can go up and down in an extraordinary scale.
I tried to fix those issues but still fail to identify root causes. Since the weirdness might indicate that there is some problem in the hardware (NIC) or its driver, we have a good reason to exclude a specific portion of data from the evaluation. See some discussions in “Annex-1. Dependency on data range” for those known issues.
First of all, please note that, in this table, VFIO (Virtual Function I/O) is listed only as a reference for comparison since its performance is obviously expected to be as optimal as the native NIC can perform. In addition, the resultant numbers may easily vary from test to test with some margin, which means that we should not immediately determine which one is the best or the worst from this table alone.
That said, looking at those results, we can find out a couple of insights:
a) Comparing the average latencies, all the bridge types perform just 7-27 microseconds behind VFIO in a benchmark-only test and 31-52 microseconds in a heavily-loaded condition with netperf. I wouldn’t say they are small numbers but they can expectedly fit into an acceptable range of latency performance under well-managed environments.
b) There is merely a subtle disparity in performance among different bridge configurations. OVS plus AF_XDP support is the best at the average and XDP is the second in this table, but, as I said, the order should not be seen as absolute.
c) The jitter is another factor to characterise the stability and reliability of packet delivery. The standard deviation in this table may represent a sort of latency jitter (a degree of diversity among sampled latencies). It gets slightly worsened by 2-5 microseconds compared to the one in a benchmark-only test but it stays narrow in general given a total number of sample data.
d) Regarding the worst-case (maximum) latency, the result looks a bit disappointing. While most sample data fall into a range under 100 microseconds as the jitters may suggest (for instance, 95.9% of samples are in a range of 40-100usec for ‘XDP with 3 netperf’ case), a not small number of samples exceeds 200 microseconds, even reaching nearly 400. This type of event can happen even in the case of VFIO, which implies that they are not directly linked to the bridge implementation.
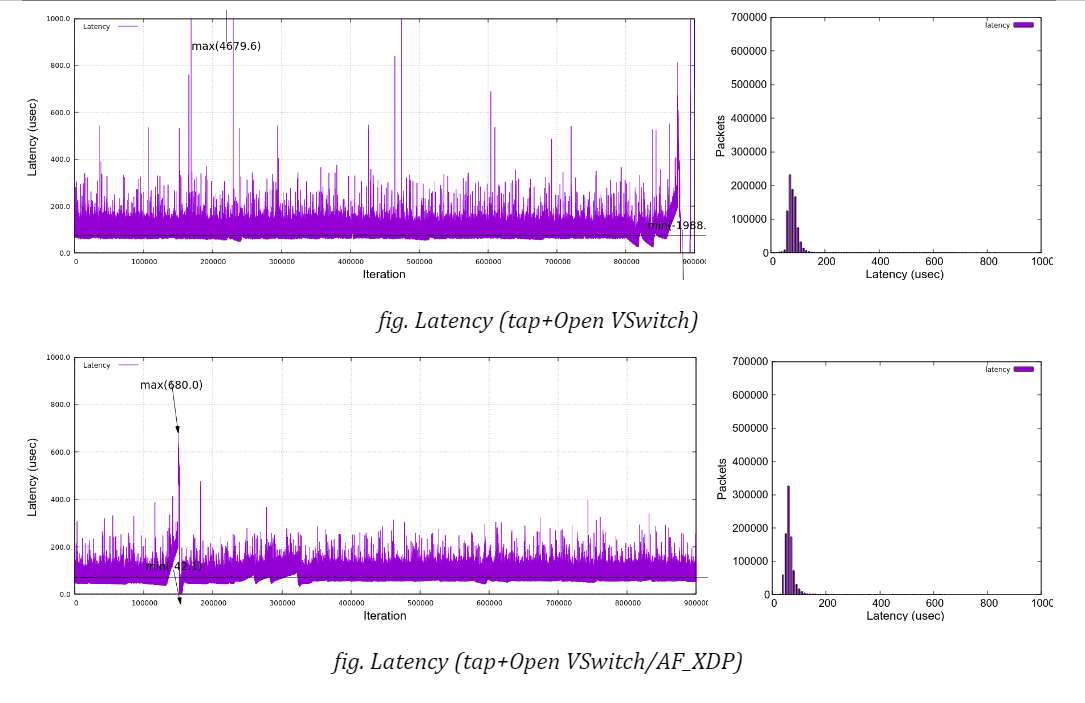
Moreover, we sometimes see the delay goes beyond 500 microseconds, which accounts for a configured Qbv cycle time. As far as I checked against a couple of arbitrarily sampled packets, those delays stem from the fact that packets were not transmitted as intended by missing out a first-available time slot at the sender’s TSN (Qbv) scheduler.
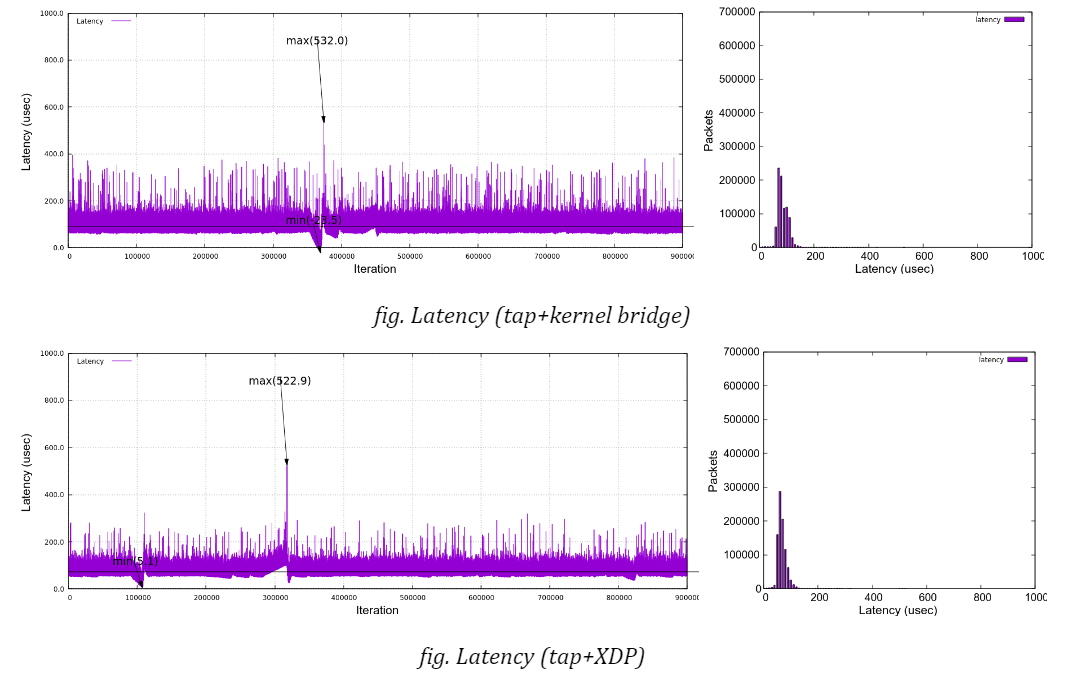
Here are the graphs, along with histograms on the right side, which plot latencies under netperf stress in time sequence for each bridge type (no netperf in VFIO case). You can confirm that all the charts expose similar characteristics except for a few singular samples as mentioned above. None of the bridge types indicate that it has a trivial advantage over the others under my test environment.
Step up this study
The aim of this study was to pick up some of the popular and/or promising bridge technologies, demonstrate how they behave under the virtual machine environment and then characterise the nature of network performance metrics, in particular, latency. The comparison result in the previous section, however, may have fallen short in satisfying your expectation. For instance, when I took on this task, some engineer said that the XDP approach could potentially outperform the existing bridge technologies, but this is not the reality as far as my experiments are concerned.
This is partly because we have a dedicated queue for the guest VM which allows for isolating the data path from other network loads and partly because the test scenario I adopted here was too simple to differentiate one from the others. Only a single guest VM was hosted on the controller side and merely a small size of packets are transmitted in as slow an interval as 1 millisecond. There is no other device, gateway nor switch in the middle of the network. As a good enough bandwidth (20% of the total bandwidth) of the time slot in Qbv is allocated for the benchmark stream, the sender has no difficulty in transmitting packets in a timely manner. A real system in a car must be more complicated by many hosted applications with various levels of requirements and hence there will be stretched restrictions against system/network configuration. It’s not surprising if we may witness slightly different behaviors under complex conditions.
On the other hand, from the viewpoint of real-time systems, we need to pay more attention to maximum latencies in order to guarantee a reliable delivery of packets. So I’m going to continue to investigate where the jitters may come from and identify the root causes of big spikes and PTP (network) disorder which can irregularly happen even in the current test environment.
In the section “Other optimisation”, I mentioned a couple of hints and tips in tuning the system to acquire the best result with some accuracy and stability. While I have concentrated on the overhead and interference imposed by the host OS or the hypervisor, the total end-to-end latencyup to the time a packet reaches the application in user space, should be a final target. As the histogram below shows,
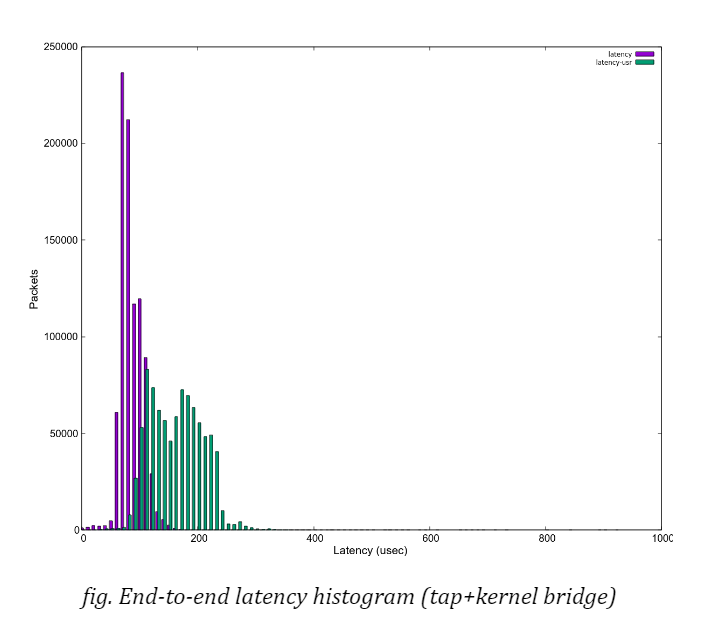
we see even more divergence in end-to-end latencies, shown as the green”latency-user” bar in the graph, due to the guest OS which is also a PREEMPT_RT linux in this case. (Please note that the cpu which houses the guest VM is fully isolated from the host kernel’s scheduler.) It is no doubt another key point to evaluate when it comes with system-wide tunings.
In addition, I would like to add one more metric in the test; a latency in the opposite direction, that is, from the application on the guest VM to the remote host. This case corresponds to a control message issued by ECU in a real automotive system and should require a real-time character as well. It is much harder to ensure that a packet is delivered in a reliable manner.
Finally, this study is still an on-going effort. As I mentioned in my last blog article I am very interested in getting additional feedback and comments from real users who are experimenting with real-time systems using TSN technology to help establish a proven test methodology and acquire more sensible and trustworthy outcomes from the experiments. I look forward to hearing from readers of this article. Please drop me a comment via contact@linaro.org.
Annex-1. Dependency on data range
The weird behaviors seen in the results include
- The latency rises sharply and drops off in a small period
- The latency fluctuates in a huge scale for a long period
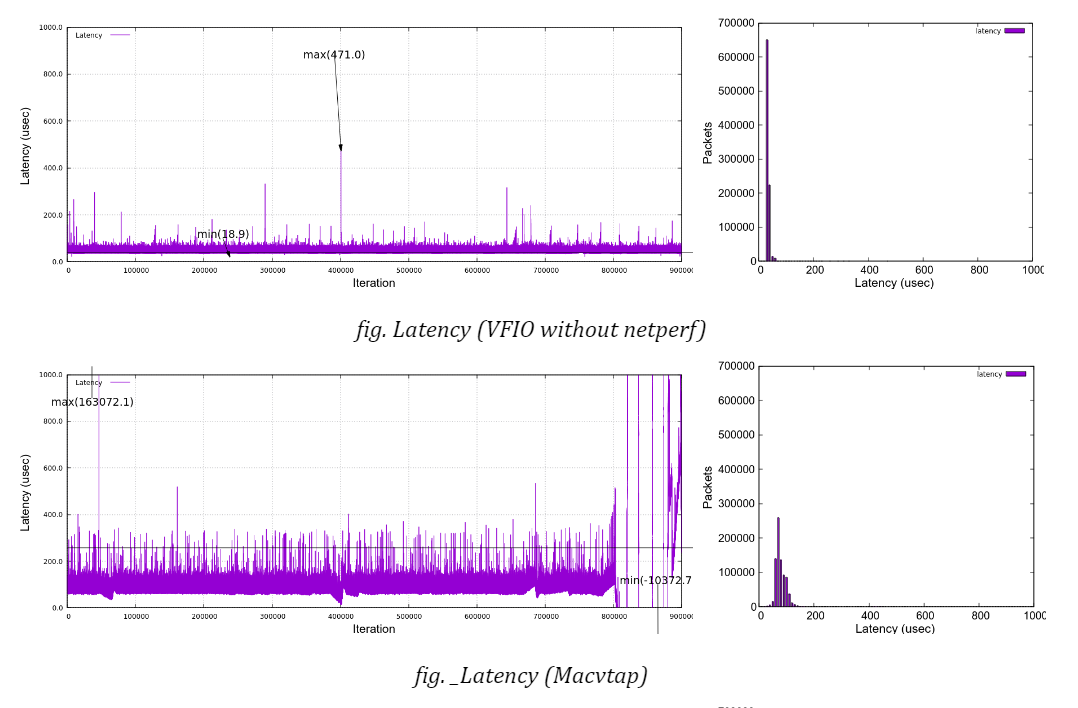
For instance, see the graph in the figure below. It illustrates the same data in figure “Latency (Macvtap)”, but in a different scale at y-axis to show the whole range of data.
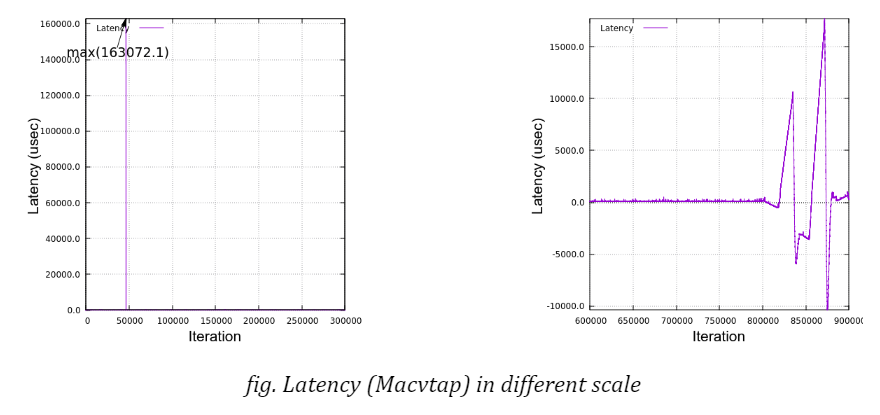
A big spike of latency reached up to 160 milliseconds and it is also sometimes seen that rather big spikes (around 6 milliseconds) occur in a periodic manner, say, at every one minute. The timestamp record shows that all the packets were sent out at the expected time but that the delivery on the receiver side seemed to be delayed (for a few milliseconds) and all the packets were suddenly received almost at once. This explains why the latencies were linearly declined.
Meanwhile, the latency may swing between a large minus and a large plus and this happens either in a smaller scale and in a bigger scale. In all cases, the degree of increasing or decreasing looks proportional in a few minutes. Thinking of the fact that PTP clock synchronisation is managed by PI (Proportional Integral) controller’s servo, this kind of behavior can be explained by an improper adjustment of clock frequency against clock’s drifting.
I want to exclude all these irregular values from statistics to understand static and average behaviors. While it is crucial to eliminate any possibility of big latencies in real-time applications, it’s a bit beyond the scope of my study here.
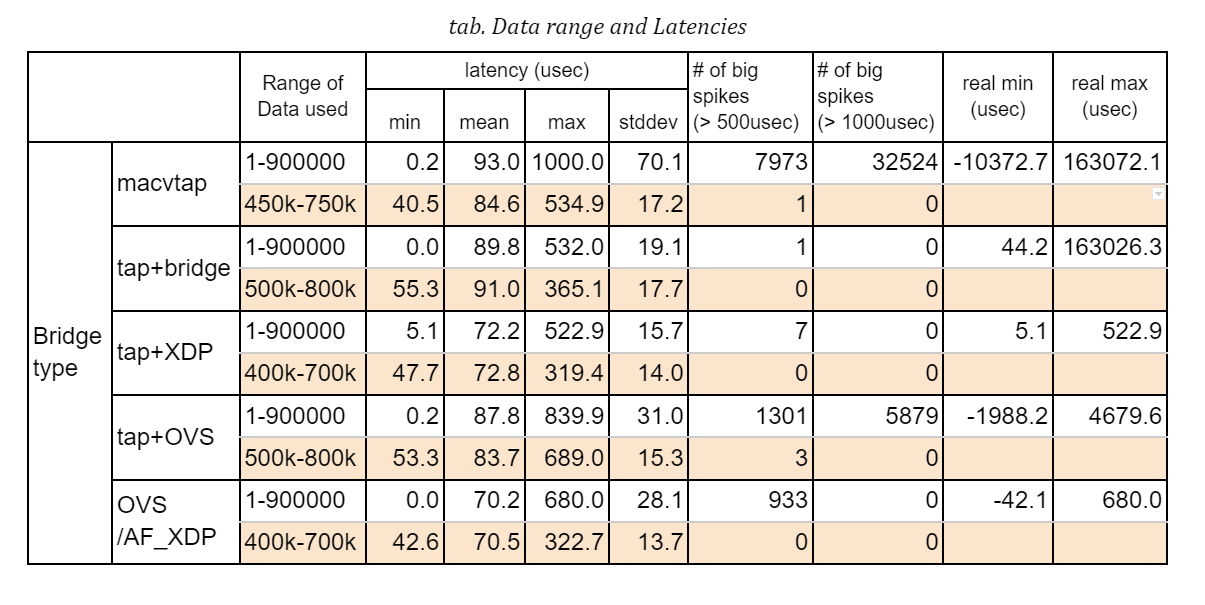
Here is the stats comparison; one for using the whole data in a 15-minute run and the other against a 5-minute portion where the latencies are relatively stable. Obviously the maximum latency drops, while the average is almost the same and the standard deviation can be reduced which I believe reflects a general character of the graphs.
Among others, ‘tap+XDP’ case seems to be pretty good throughout the whole range, but please note again that the result can vary and it’s quite likely that we may see big spikes even in XDP case too.