We’re thrilled to announce the new release to the Visual Studio Marketplace of the WindowsPerf Visual Studio Extension, version 2.1.0. This major update introduces essential features designed to enhance performance profiling on Windows on Arm. This version is compatible with WindowsPerf 3.7.2. WindowsPerf is a performance profiling tool inspired by Linux Perf, tailored for Windows on Arm. It utilizes the Arm Performance Monitor Unit (PMU) and its hardware counters to deliver Arm CPU microarchitecture profiling capabilities.
How to install WindowsPerf GUI extension?
The tool can be downloaded from the Visual Studio Marketplace or directly from the Visual Studio IDE by selecting from menu Extensions > Manage Extensions… and search for the WindowsPerf GUI.
Note: To install WindowsPerf 3.7.2 on your Windows on Arm system follow steps described here.
Why WindowsPerf GUI?
The command line interface of WindowsPerf, while powerful, can be challenging for many users. The WindowsPerf GUI project was created to provide a more user-friendly interface, allowing developers to adjust settings, run profiling, and visualize results directly within the Visual Studio IDE, making the whole process more intuitive and integrated.
What’s New in this release
You can read more about the previous extension release in the New Release: WindowsPerf Visual Studio Extension v1.0.0 blog post.
New Counting Model
What is the counting model
The counting model provides a general performance statistic for a program. You can either attach it to a running (own) process, monitor a new process or monitor the whole system. This returns an aggregate count of occurrences of selected events, event groups and metrics.
This model is implemented in WindowsPerf user space through the command wperf stat and using the --json flag it returns the data in a JSON format that can be exploited by the extension.
The counting model in the extension
The new counting UI includes a wperf stat command builder.
- This widget allows users to select CPU cores, target payloads (optional), metrics, and events.
- Users can also group events to create counting event groups.
- Counting results can be previewed within the Visual Studio IDE or analyzed more thoroughly in Windows Performance Analyzer (WPA) - this requires WindowsPerf WPA-plugin installation.
- WPA-plugin can import WindowsPerf JSON output (from counting, e.g. timeline output) to WPA for further analysis.
Check out our Counting Settings Tutorial for more information.
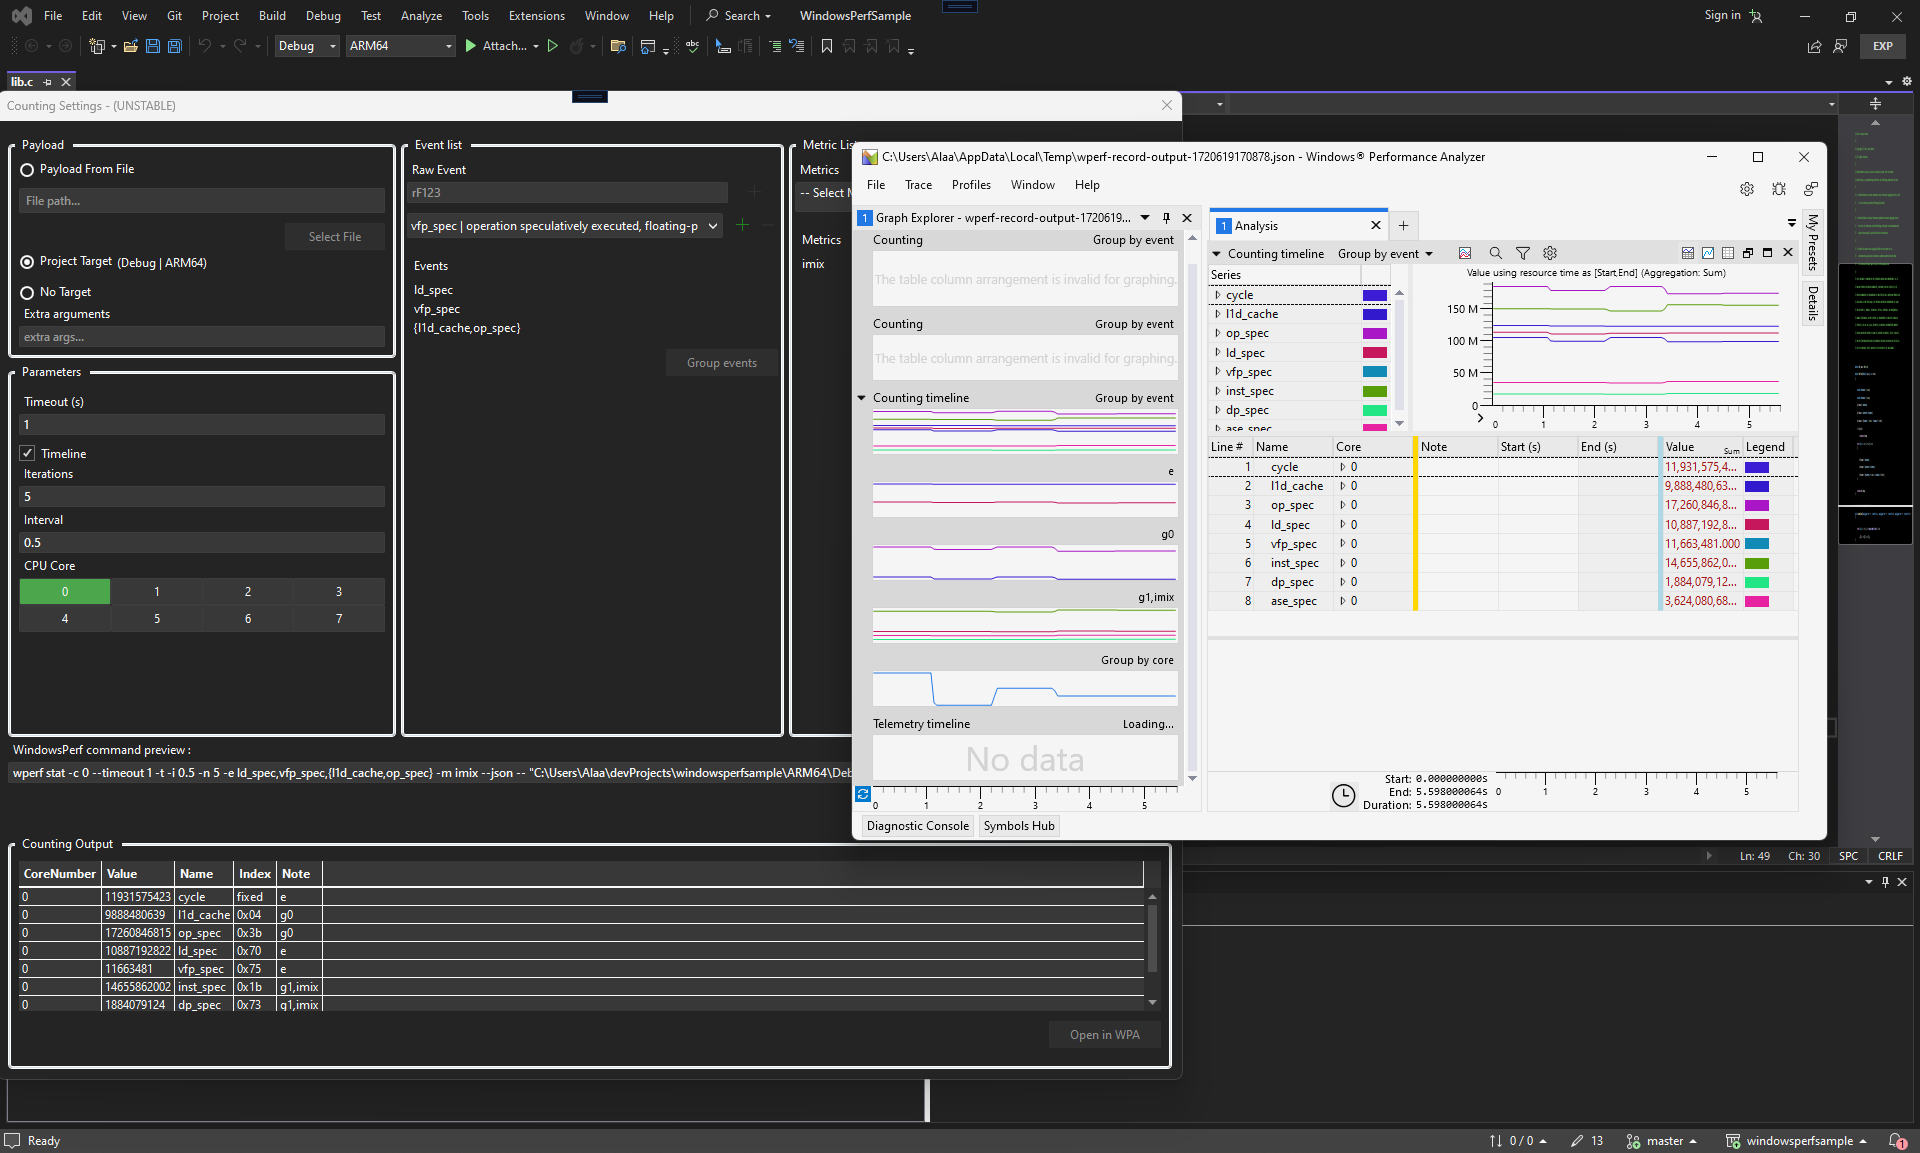
WindowsPerf GUI Counting Settings Example
 Above you can see WindowsPerf GUI Counting Settings window with example counting results and launched WPA-plugin in WPA.
WindowsPerf WPA-Plugin
What is Windows Performance Analyzer
Windows Performance Analyzer (WPA) is a tool that creates graphs and data tables of Event Tracing for Windows (ETW) events that are recorded by Windows Performance Recorder (WPR), Xperf, or an assessment that is run in the Assessment Platform. WPA can open any event trace log (ETL) file for analysis.
WPA capabilities can be expanded upon using the Microsoft Performance Toolkit SDK by creating plugins which enable parsing any type of data (WindowsPerf JSON output in our case).
WPA-plugin functionality
- In order to visualize the output of WindowsPerf, WPA-plugin bridges the gap between the detailed output of WindowsPerf and the powerful visualization capabilities of WPA.
- The plugin is built on the Microsoft Performance Toolkit SDK and is shipped as a single Dynamic Link Library (DLL) file that can be downloaded from the release page.
- WPA can be launched from within Visual Studio thanks to our extension. A button is shown after a successful count is executed and opens the results in a new WPA window.
- Installation details and further reading are available on the WPA Plugin Wiki.
Example WindowsPerf counting data imported to WPA via WPA-plugin.

Lock-Unlock feature
When WindowsPerf communicates with its Kernel Driver, the driver acquires lock and will deny access to other instances of WindowsPerf accessing the driver and its resources. This prevents others from interfering with the current WindowsPerf execution and protects you from interference with your count.
When another WindowsPerf process has “locked” access to the driver you will no longer be able to use WindowsPerf, you will instead receive the following error message:
warning: other WindowsPerf process acquired the WindowsPerf-driver.
Operation canceled!
In order to force the release of the lock, a new --force-lock command argument was introduced to both WindowsPerf and the extension that lets you interrupt the ongoing WindowsPerf process and take over the lock.
However, interrupting a running wperf process would result in losing all the collected data. If interrupted, WidowsPerf will show the following error message:
warning: other WindowsPerf process hijacked (forced lock) the wperf-driver, see --force-lock.
Operation terminated, your data was lost!

Received ERROR_BAD_COMMAND, driver status:
STATUS_INVALID_DEVICE_STATE
error: PMU_CTL_LOCK_RELEASE can't be release
Disassembly Support in Sampling
Disassembly support has been added to provide an in-depth examination of performance hotspots.
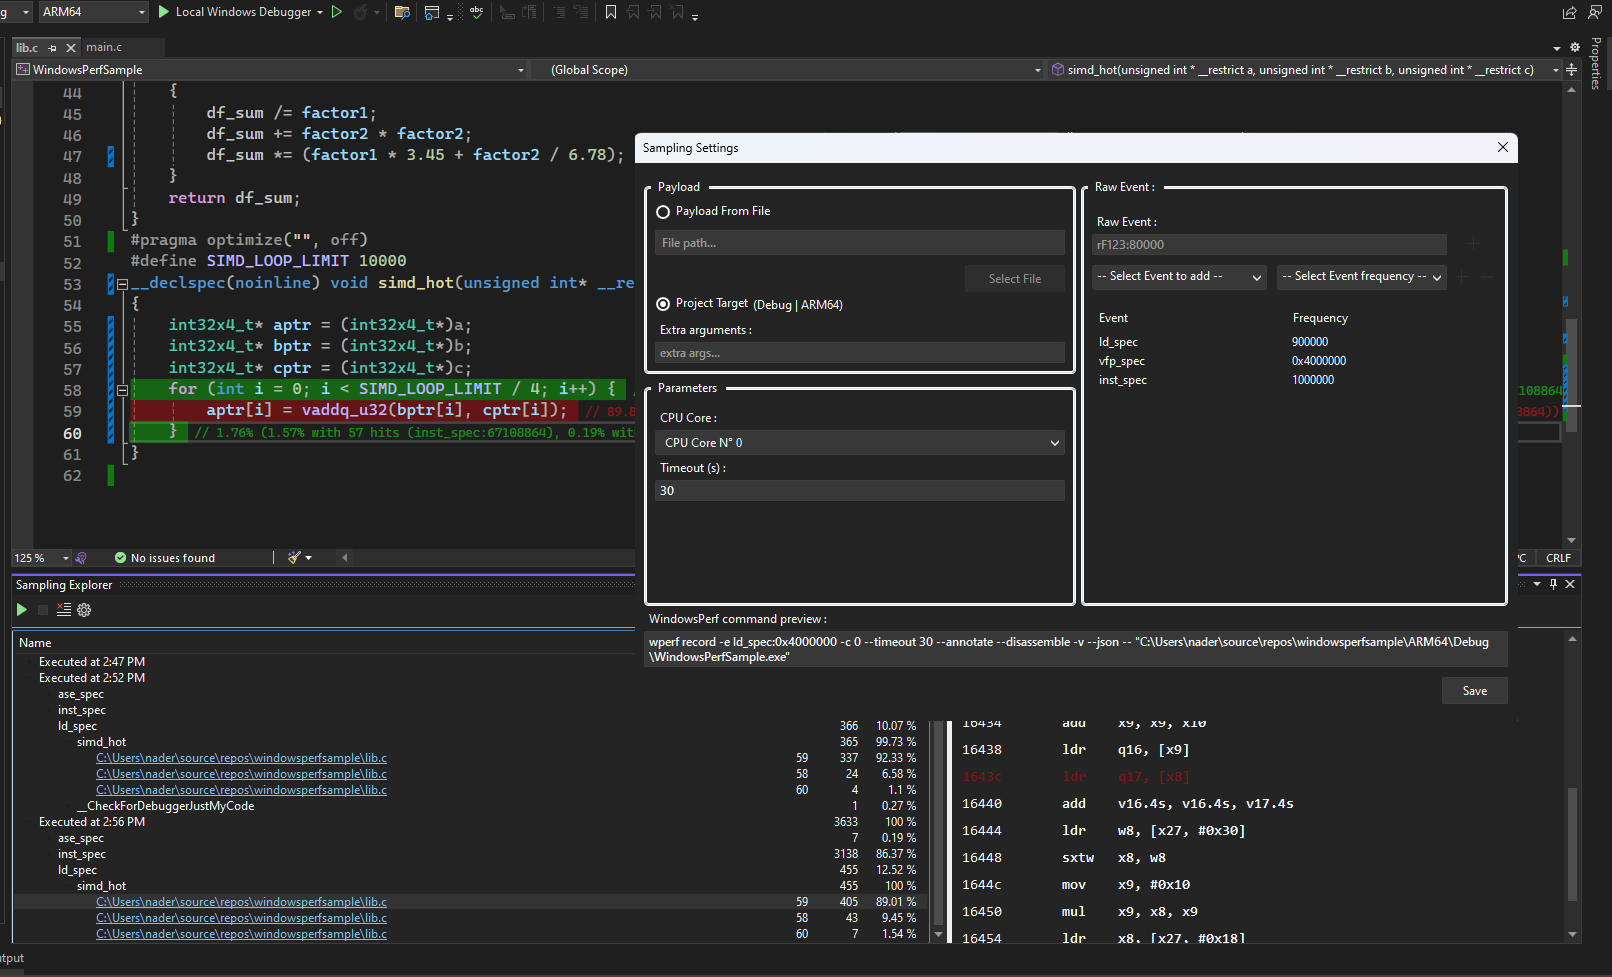
- Added disassembly output from sampling runs to the Sampling Explorer widget, providing users with the opportunity to dive deeper into the most frequently executed instructions.
- Enhanced the editor by adding line highlighting to better identify hotspots directly in the codebase.
- Improved the percentage display in the Sampling Explorer table
Explore how to leverage this powerful feature in our Sampling Explorer Tutorial.
Example Extension Sample Settings Window with sampling output in Visual Studio IDE

UX Improvements
The extension now features a “Build and Run” button, ensuring all performance tests are conducted on the latest code version. Additionally, improvements such as case-insensitive event search and tooltips when you hover on certain icon buttons have been implemented to streamline the user experience.
What’s next?
We are committed to continuously improving the WindowsPerf Visual Studio Extension to include all the latest features from WindowsPerf itself. The next extension release should provide compatibility with the latest WindowsPerf. You should expect alignment with the latest WindowsPerf release, better support for Telemetry Solution integration and support for lock/unlock functionality. Stay tuned for future updates!
Open Source
The extension is open sourced and freely available under the BSD license.
Feedback
We hope you enjoy the new features and improvements! You can find out more by visiting our repository or checking out this presentation. We’re always looking to make things better, so your feedback in the marketplace or through issues and merge requests is always welcome.


