


Introduction
We’re excited to announce the release of Linaro Forge 26.0. The headline feature of this release is the ability to profile NCCL collectives with Linaro MAP and Performance Reports, which now tracks the time spent in NCCL ops so far, the number of bytes that NCCL ops operate on per second and NCCL point-to-point/collective ops per second. Performance Reports now includes a dedicated NCCL section that report NCCL transfer rate and the time of underlying kernels, with a breakdown by NCCL op type.
Alongside our headline NCCL profiling feature, we have also made several improvements within the product. Most notably, We have extended the GDB multiplexing architecture to DDT, delivering up to 80% reduction in DDT memory usage. We have also added dedicated support for the Flux job scheduler, bringing Linaro Forge to the next-generation job scheduler that is being adopted across major HPC facilities. Finally, we have simplified debugging and profiling of non-MPI parallel jobs by adding in the command-line option --start-at-main for MAP, DDT and Performance Reports.
For more details on each of these features, please see the Linaro Forge user guide.
NCCL Collectives profiling with Linaro MAP
As distributed ML training scales across larger GPU clusters, the question that keeps coming up is: where is my training time actually going? The answer is increasingly within the GPU-to-GPU communication layer. Until now, that communication layer has been difficult to observe holistically at large scale.
NCCL (NVIDIA Collective Communications Library) is the communication backbone of distributed training on NVIDIA GPUs It handles gradient synchronisation, parameter gathering, and data redistribution using collective operations like AllReduce, AllGather and ReduceScatter. These collectives move data across GPUs over NVLink, NVSwitch, or InfiniBand. The performance of these collectives across nodes, has a direct impact on the training throughput.
Linaro MAP collects dedicated GPU-side communication metrics across all ranks. There are no code changes or recompilation of code required to use Linaro MAP or Performance Reports, giving you system-level context that enables you to easily fine-tune the distributed training performance across multiple nodes.
The goal of this blog is to demonstrate how to identify communication overhead between nodes, and optimise GPU utilisation in a multi-node, multi-GPU environment. By the end of this blog, you will have a practical understanding of how to profile distributed GPU workloads and the tools and techniques needed to get the most out of your multi-node setup.
Tuning nccl-tests with Linaro MAP
Let’s walk through a tuning exercise using NVIDIA’s nccl-tests suite — the standard benchmark that NCCL engineers use to establish baselines and validate tuning changes.
Step 1: Build nccl-tests
1. git clone https://github.com/NVIDIA/nccl-tests.git
2. cd nccl-tests
3. make MPI=1
Step 2: Establish a Baseline
First, see what NCCL auto-selects by running with NCCL_DEBUG=INFO:
1. export NCCL_DEBUG=INFO
2. srun -n 8 --ntasks-per-node=4 \
3. ./build/all_reduce_perf -b 1G -e 1G -g 1 -n 300
The NCCL_DEBUG=INFO output will show you which algorithm and protocol NCCL selected in the output.
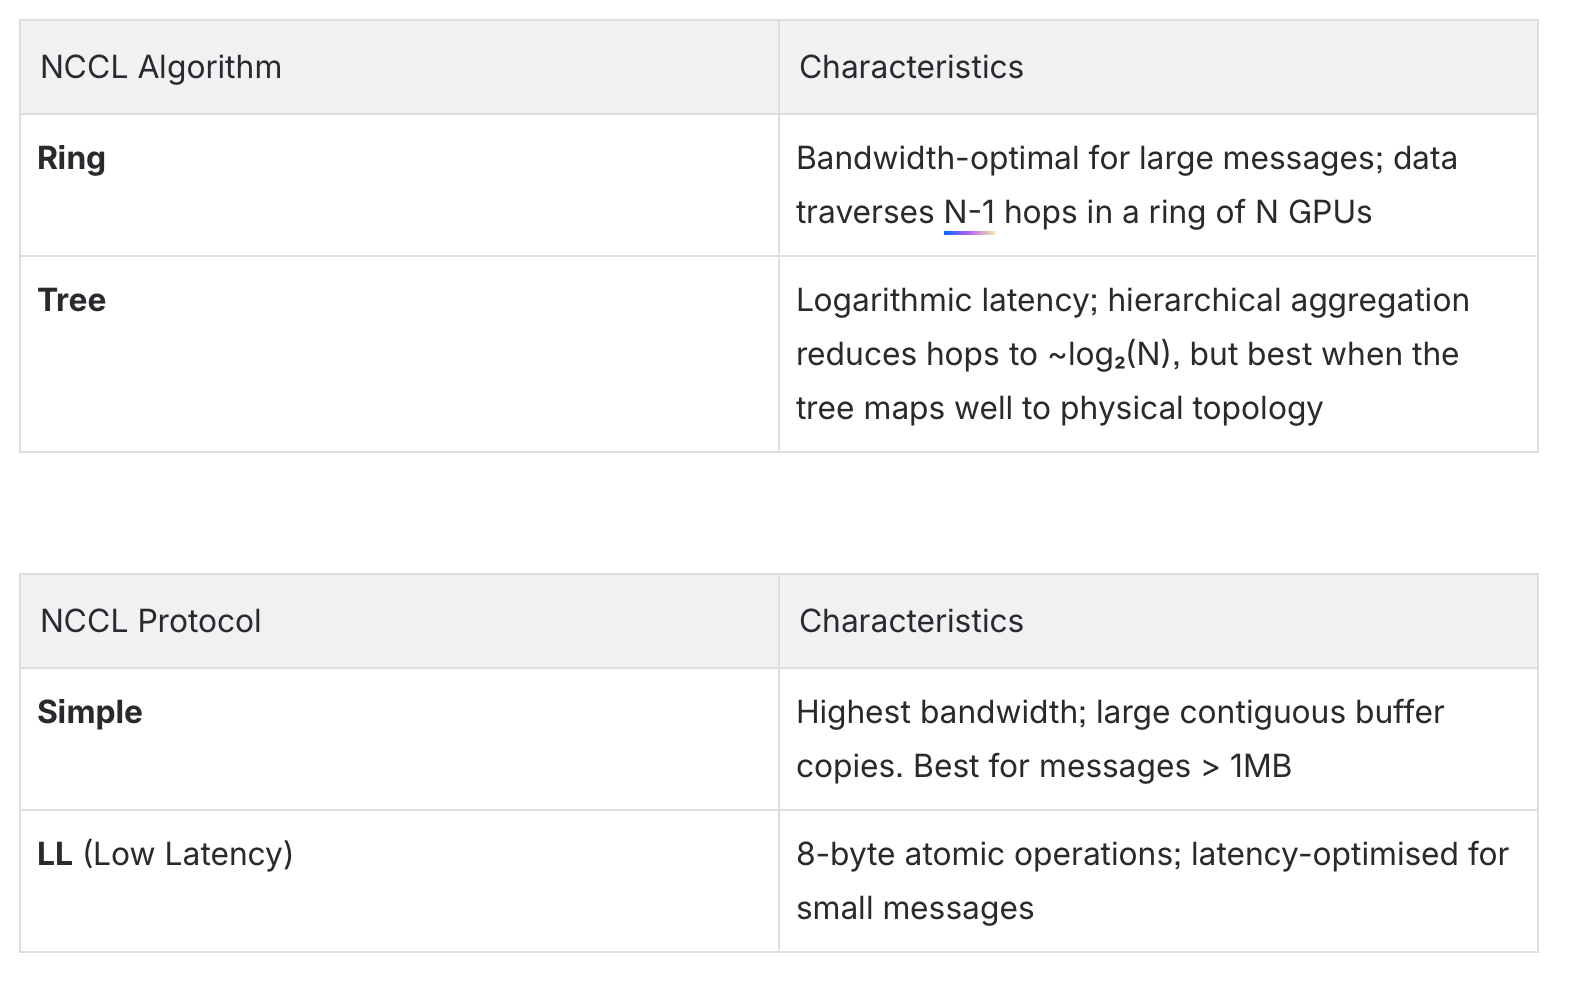
The following table summarises the characteristics of the NCCL algorithms and protocols explored in this blog. Under the hood, NCCL selects both an algorithm (which determines how data flows between ranks) and a protocol (which controls how data is transferred at the software level). The interplay between these two choices, combined with your specific interconnect topology and message sizes, is where tuning gains can be found.
For this blog, we focus exclusively on the Ring and Tree algorithms paired with the Simple and LL protocols. NCCL supports additional algorithms and protocols, but limiting our scope to these four combinations allows us to clearly demonstrate how each choice impacts AllReduce performance on a 2-node, 8-GPU Cray Slingshot-11 topology.
Step 3: Profile the Baseline with MAP
All that is required to obtain a MAP profile is to prepend map --profile to the srun command. This will run the benchmark as we did in step 2, but this time a MAP profile will be generated to obtain insights into the application.
1. map --profile srun -n 8 --ntasks-per-node=4" \
2. ./build/all_reduce_perf -b 1G -e 1G -g 1 -n 300
Open the resulting .map file to view the NCCL communication metrics, select Metrics → Preset: NCCL from the menu bar. This loads a curated set of NCCL specific metrics. These presets provide a focused view of the collective communication behaviour across all ranks.
However, NCCL metrics alone only tell part of the story. To build a more complete picture of your application’s performance, you can layer in additional metric presets or add individual metrics alongside the NCCL view. For example, selecting Metrics → Preset: GPU Power overlays GPU power consumption, allowing you to correlate GPU energy draw with NCCL collective activity.
Similarly, the GPU Kernels tab identifies exactly which NCCL kernel variants are running, confirming whether NCCL honoured your forced configuration or silently overrode it.
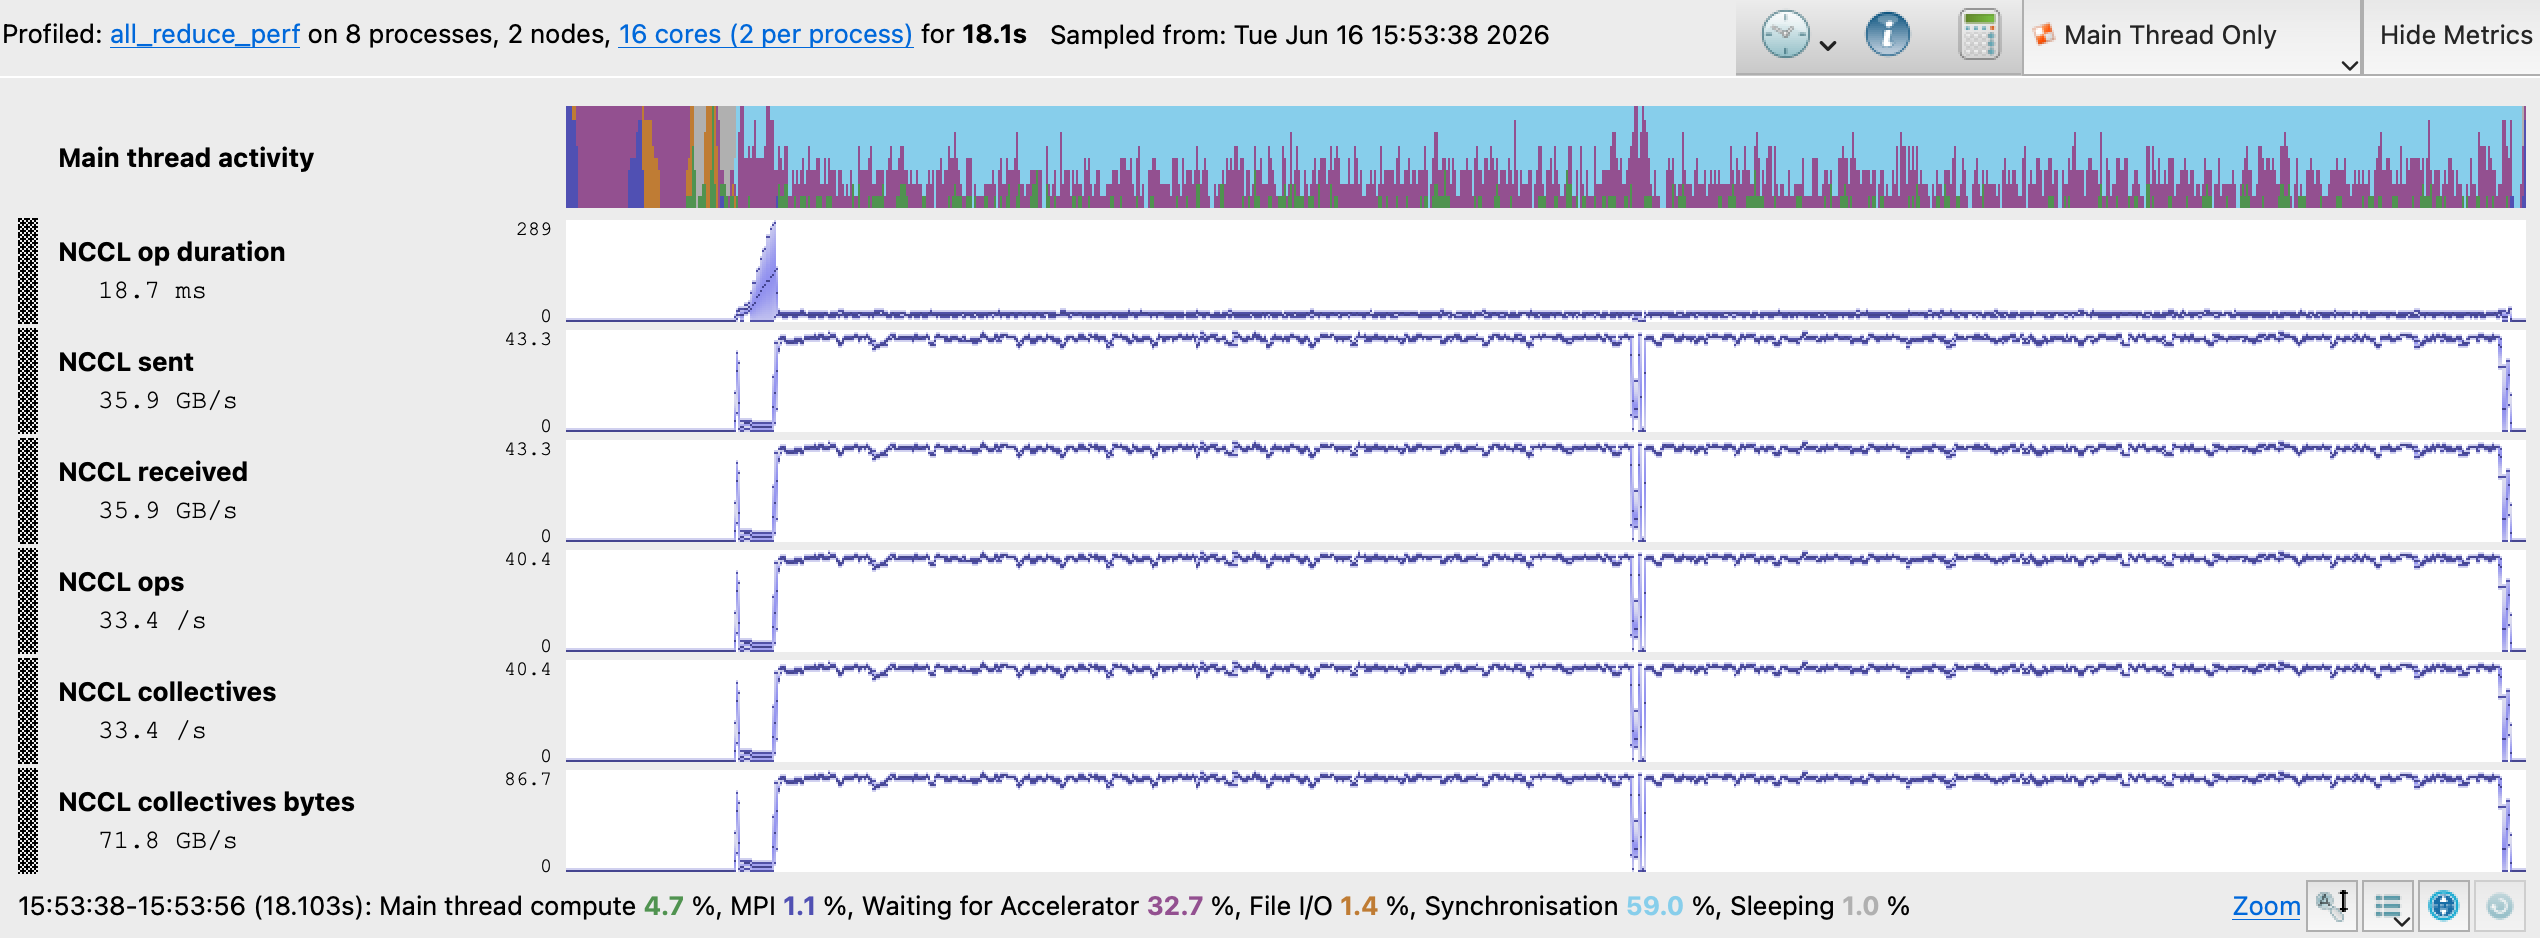
Baseline NCCL Metrics
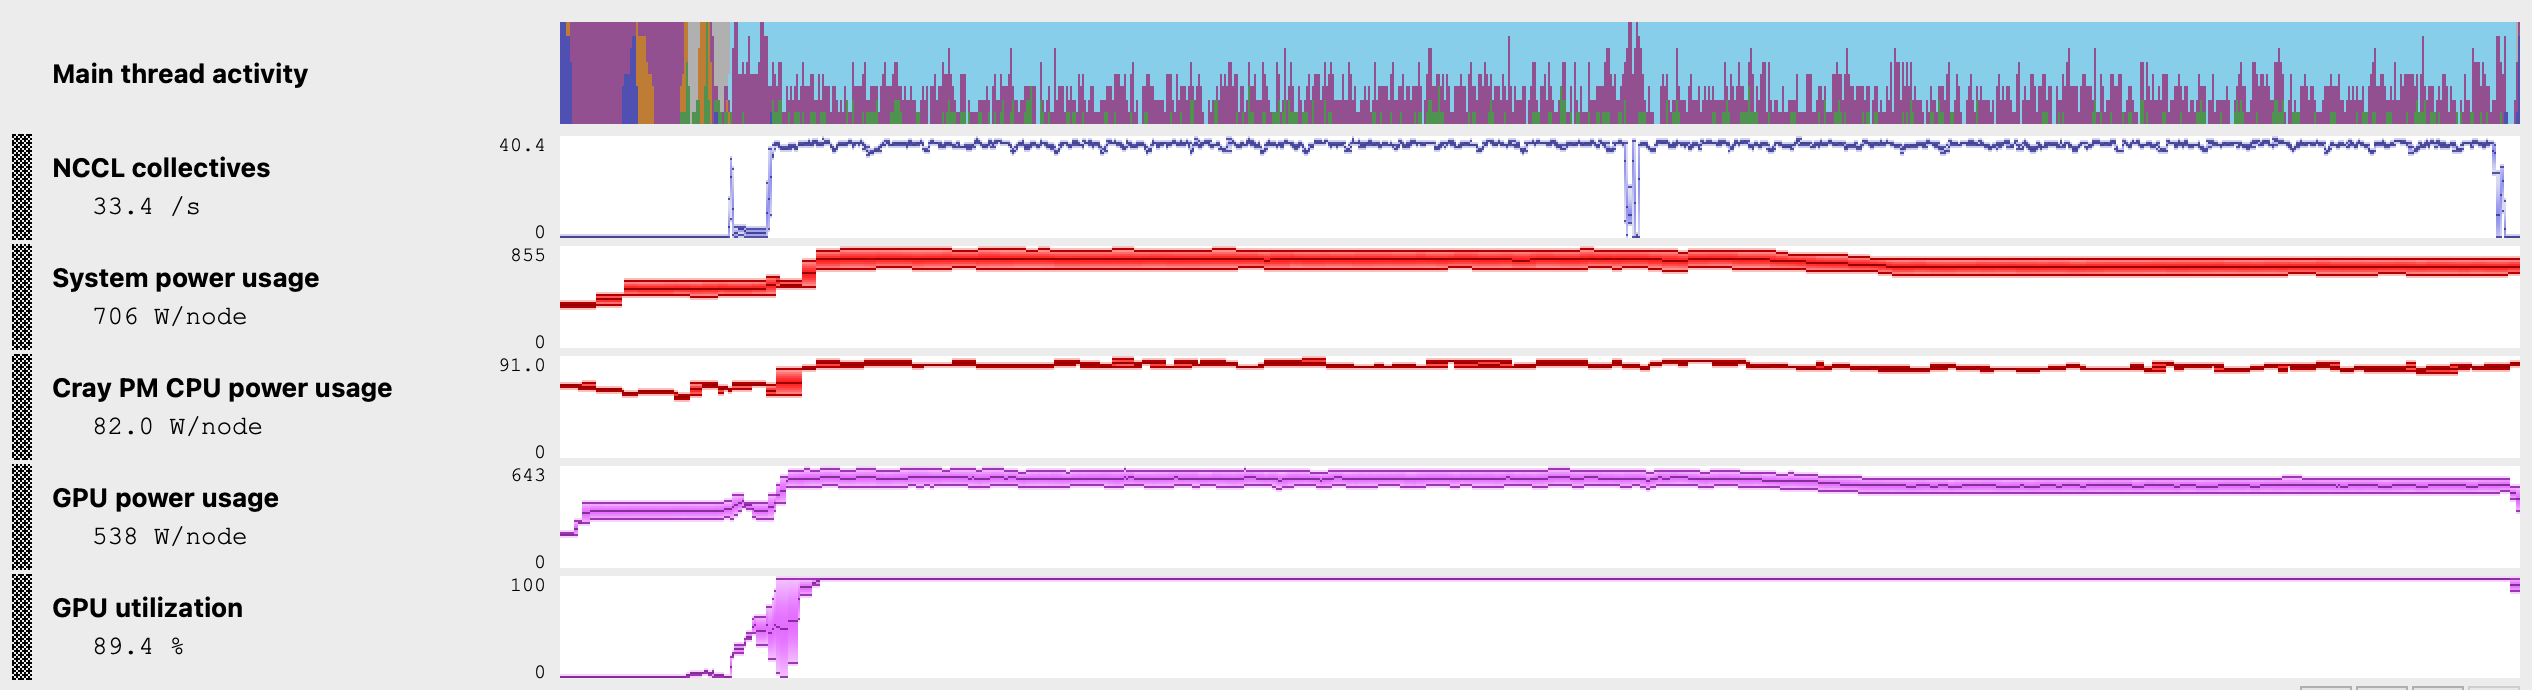
Baseline Energy Metrics
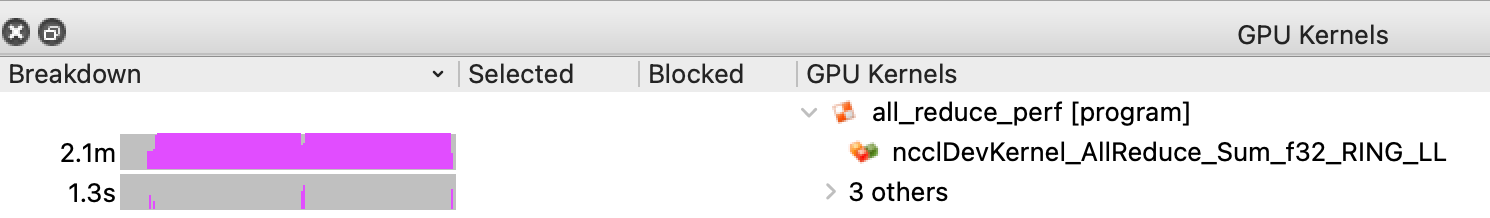
Baseline GPU Kernels
Key Observations
The MAP NCCL metrics timeline reveals a well-balanced baseline configuration. Each AllReduce collective completes within an average of 18.7 ms, with a consistent band of NCCL op durations across the run, indicating no obvious rank imbalances after an initial set up period. NCCL Sent and received metrics are symmetric at 35.9 GB/s, with an aggregate NCCL collectives throughput of 71.8 GB/s. NCCL ops and NCCL collectives are identical at 33.4 /s, confirming that 100% of operations are NCCL collectives with no unexpected point-to-point communication. This is as expected for all_reduce_perf.
The visible drop in NCCL metrics in the middle of the profile corresponds to an interval where the benchmark launches a second batch of AllReduce operations after completing the first batch. The GPU power usage of 538 W/node is steady when the first batch of AllReduce operations are executing and then drops slightly as the second batch completes its AllReduce operations.
The GPU Kernels tab confirms that all collective communication uses AllReduce operations with the Ring algorithm, with 2.1 minutes of cumulative GPU kernel time spent executing ncclDevKernel_AllReduce_Sum_f32_RING_LL across all ranks. This confirms that NCCL auto-selected the Ring algorithm with the LL protocol.
Step 4: Experiment with Algorithm and Protocol Overrides
Now the interesting part. Force different algorithms and re-profile to see what changes:
Algorithm tuning (experiment A)
1. export NCCL_ALGO=Tree
2. export NCCL_PROTO=Simple
3. map --profile srun -n 8 --ntasks-per-node=4" \
4. ./build/all_reduce_perf -b 1G -e 1G -g 1 -n 300
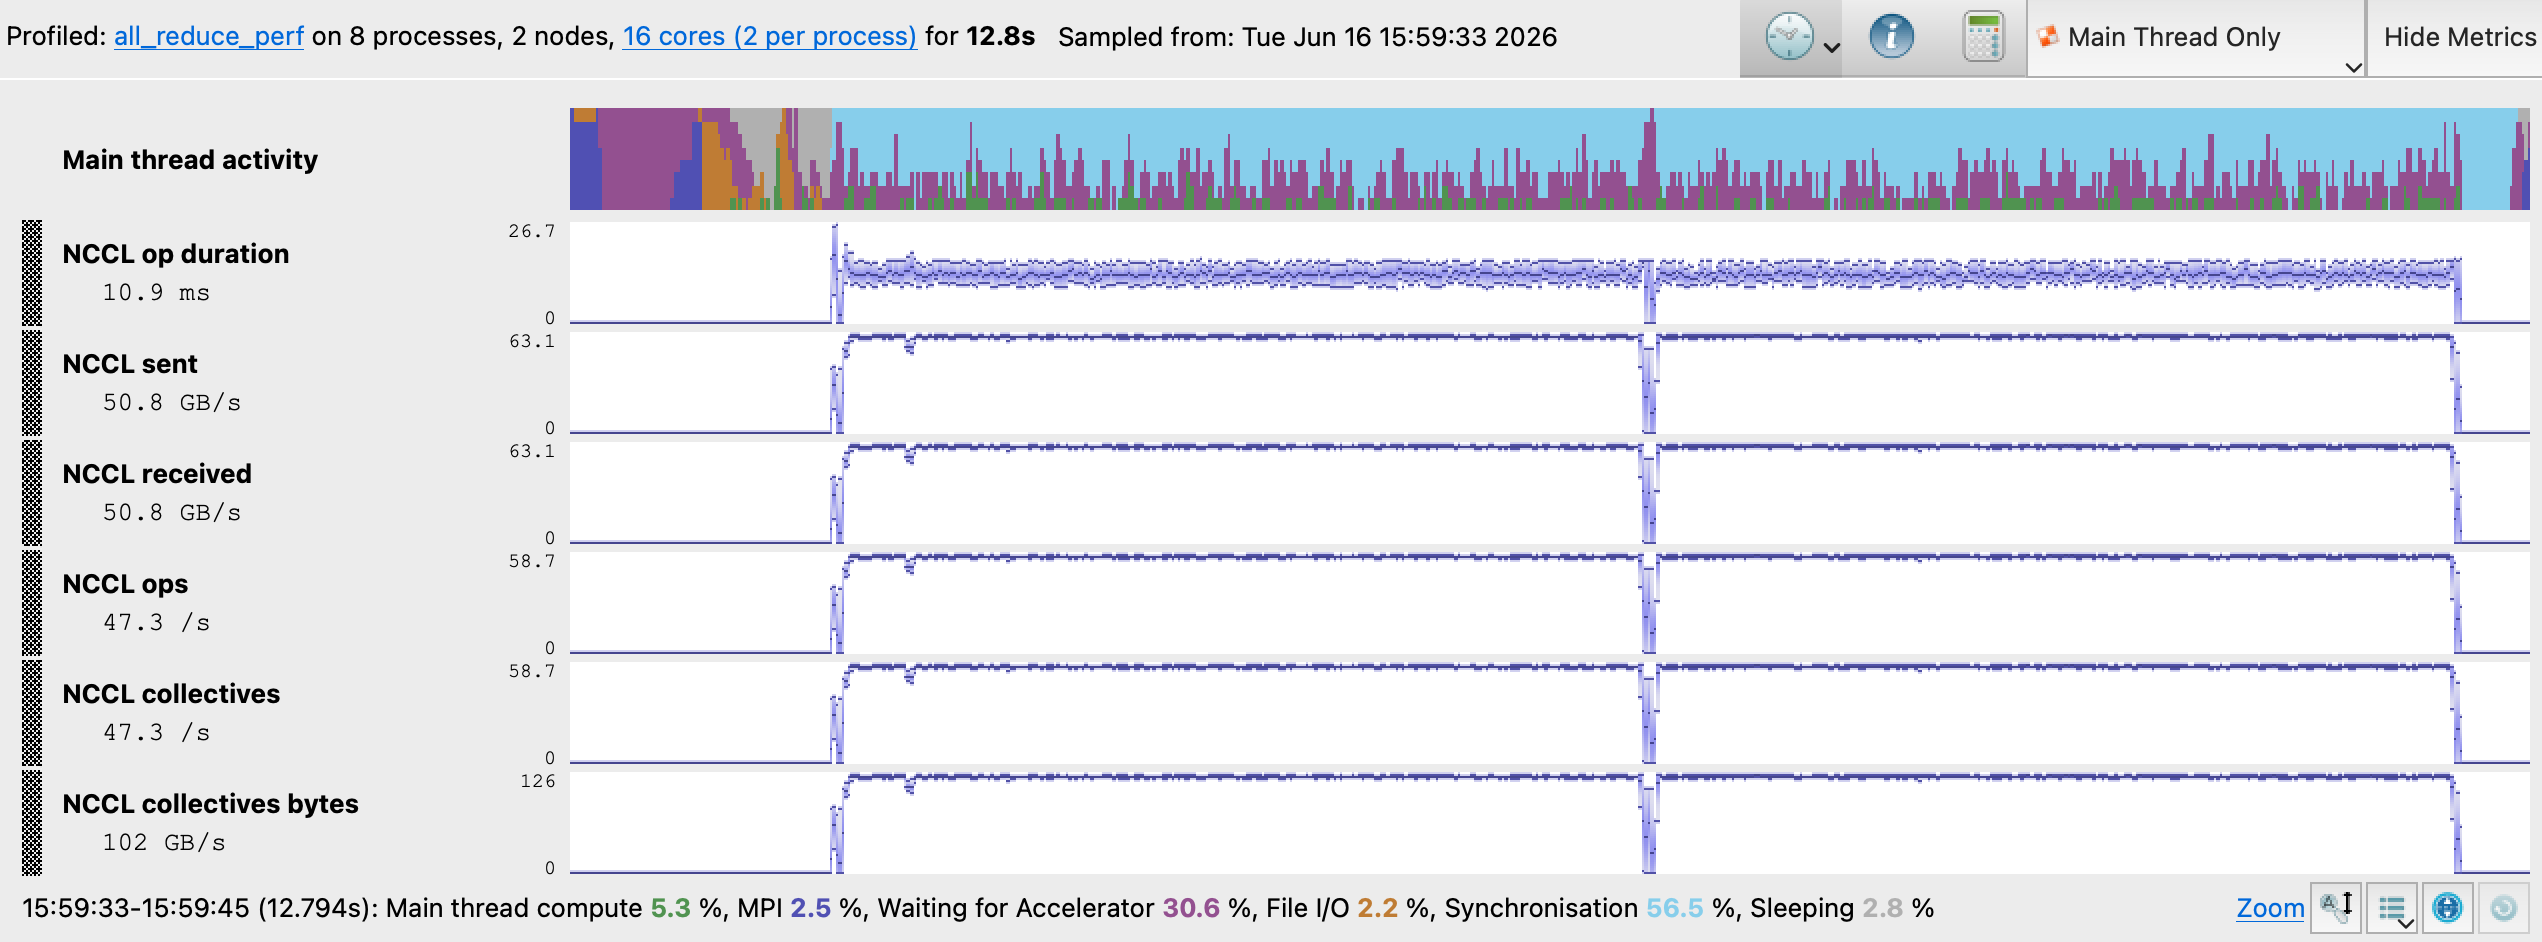
Experiment A NCCL Metrics
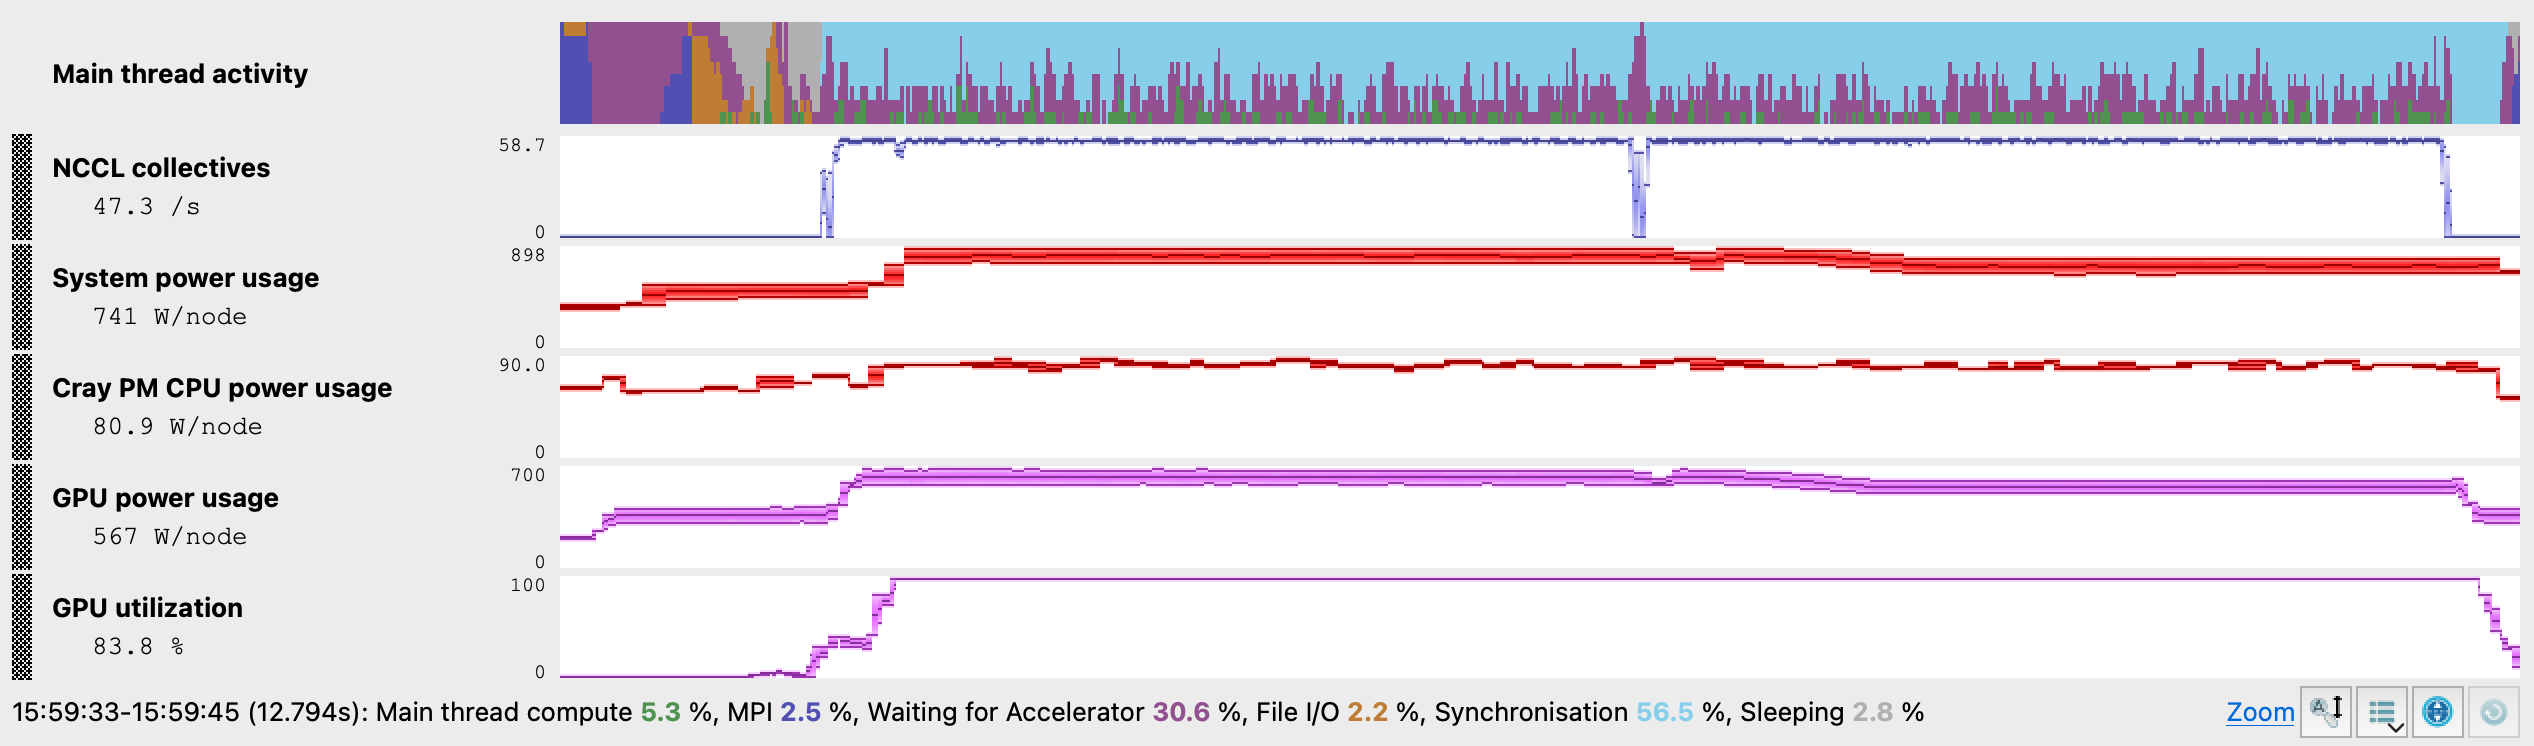
Experiment A Energy Metrics
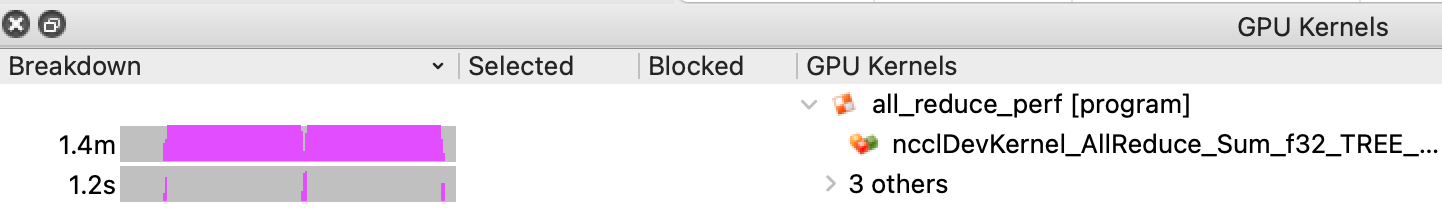
Experiment A GPU Kernels
Key Observations
NCCL op duration dropped 42% from 18.7 ms to 10.9 ms which indicates a speedup in AllReduce operations. Notice that in the baseline, there was an initial sawtooth in the NCCL op duration at the start. This indicates a bottleneck caused by an imbalance when setting up the first set of AllReduce operations. By changing the Algorithm to Tree, the bottleneck is removed. NCCL Sent and received metrics rose from 35.9 GB/s to 50.8 GB/s, with an aggregate NCCL collectives throughput increase of 42% against the baseline.
The GPU Kernels tab confirms the GPU kernel changed from ncclDevKernel_AllReduce_Sum_f32_RING to ncclDevKernel_AllReduce_Sum_f32_TREE, with cumulative GPU kernel time dropping 33% from 2.1 minutes to 1.4 minutes across all ranks. The overall benchmark run time decreased 41% from 18.1s to 12.8s which is a clear improvement over the baseline.
GPU power usage increased modestly from 538 to 567 W/node, but the 41% shorter run time means total energy consumed is lower in this experiment. MPI rose from 1.1% to 2.5%, consistent with the Tree algorithm’s hierarchical structure requiring more MPI coordination.
Protocol tuning (experiment B)
1. export NCCL_ALGO=Tree
2. export NCCL_PROTO=LL
3. map --profile srun -n 8 --ntasks-per-node=4" \
4. ./build/all_reduce_perf -b 1G -e 1G -g 1 -n 300
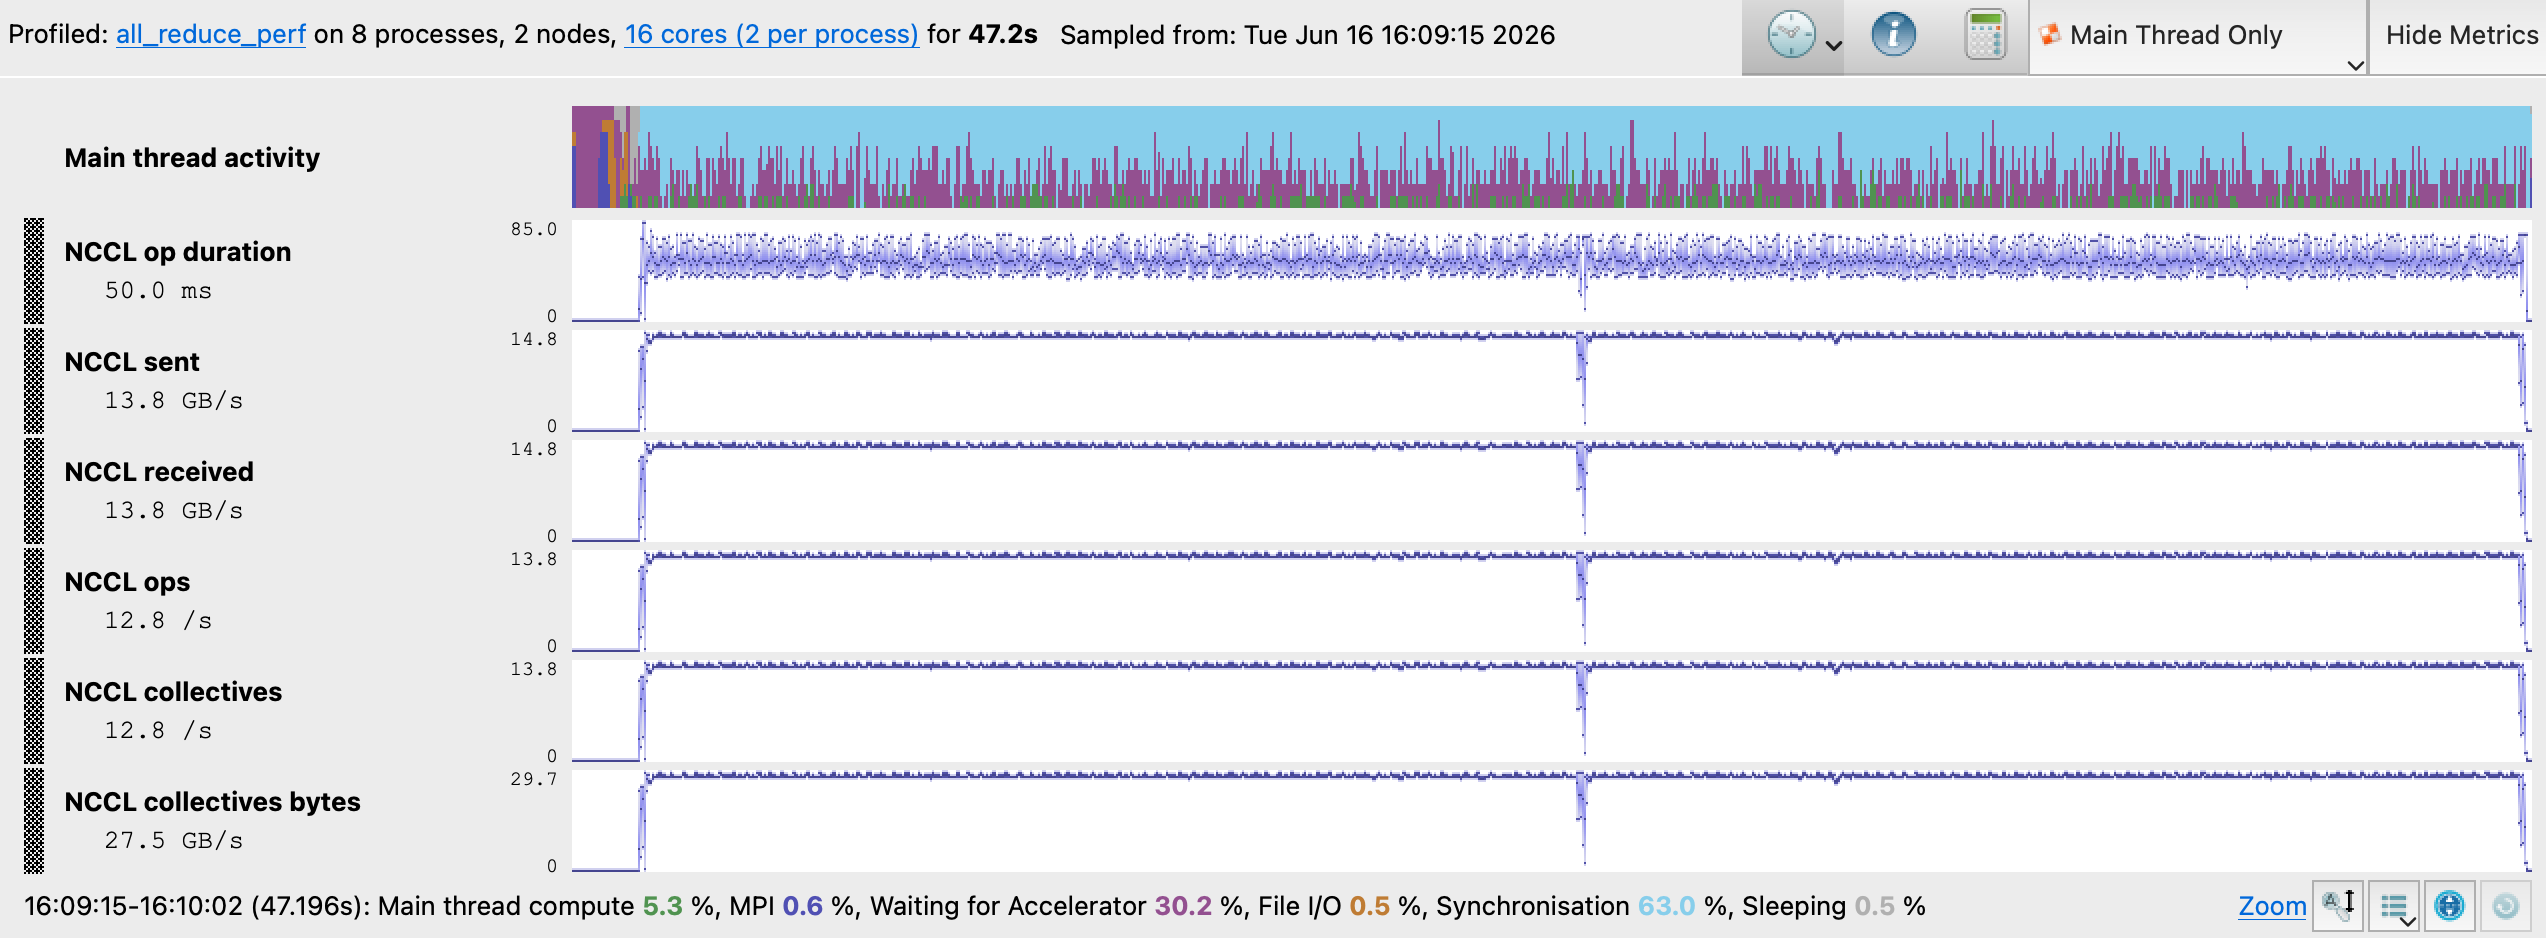
Experiment B NCCL Metrics
Metrics B Energy Metrics
Experiment B GPU Kernels
Key Observations
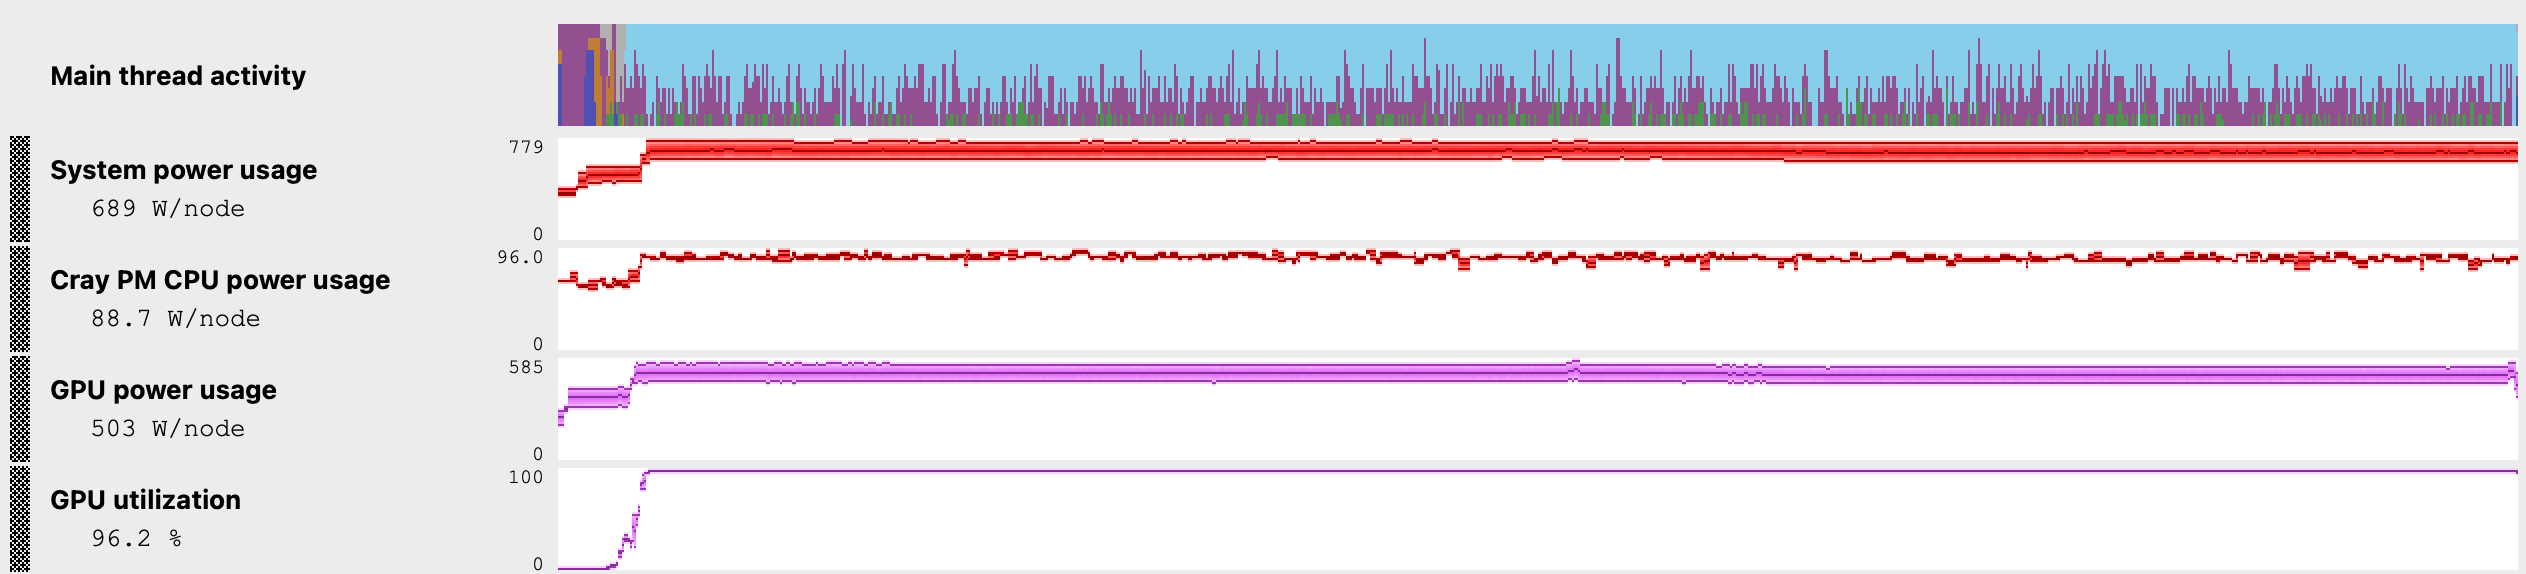
The MAP NCCL metrics timeline for Experiment B reveals a catastrophic regression from Experiment A. NCCL op duration increased from 10.9 ms to 50 ms, and sent/received dropped from 50.8 GB/s to 13.8 GB/s, with aggregate collectives throughput falling from 102 GB/s to 27.5 GB/s. This experiment shows that the LL protocol’s 8-byte atomic transfer model is unable to saturate the Slingshot-11 fabric.
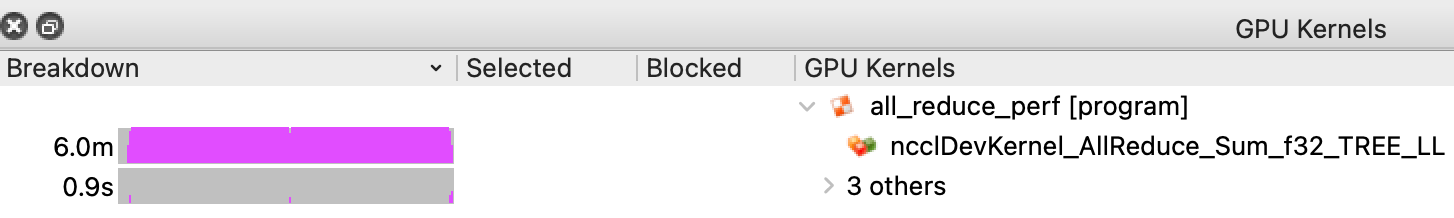
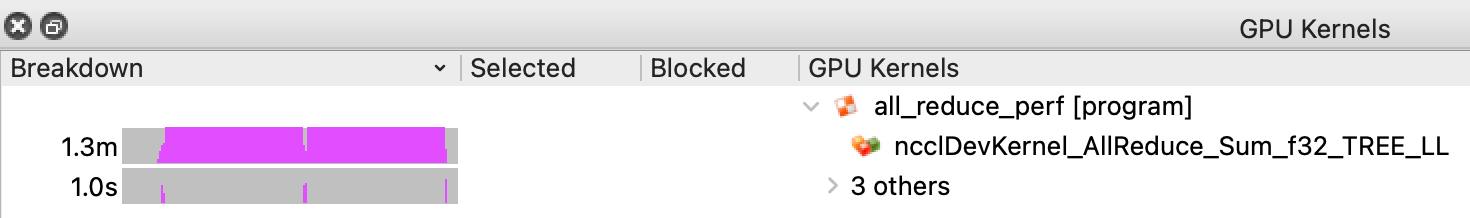
The overall benchmark run time increased to 47.2s, demonstrating that the LL protocol’s overhead at this message size overwhelms any algorithmic benefit the Tree topology provided in experiment A. The GPU Kernels tab confirms cumulative kernel time increased from 1.4 minutes to 6 minutes executing the ncclDevKernel_AllReduce_Sum_f32_TREE_LL kernel.
Interestingly, the GPU power usage dropped, although, combined with the longer run time, this makes Experiment B the least efficient configuration both in performance and total energy consumed by the GPU.
Buffer and channel tuning (experiment C)
1. export NCCL_ALGO=Tree
2. export NCCL_PROTO=Simple
3.
4. export NCCL_NET_GDR_LEVEL=SYS
5. export NCCL_MIN_CTAS=4
6. export NCCL_BUFFSIZE=8388608 # 8MB instead of default 4MB
7. map --profile srun -n 8 --ntasks-per-node=4" \
8. ./build/all_reduce_perf -b 1G -e 1G -g 1 -n 300

Experiment C NCCL Metrics

Experiment C Energy Metrics
Experiment C Time spent in GPU Kernels
Key Observations
The MAP NCCL metrics timeline for Experiment C shows the strongest performance of all four experiments. The combination of reverting to the Simple protocol, enabling GPU Direct RDMA via NCCL_NET_GDR_LEVEL=SYS, increasing buffer sizes to 8 MB, and adding NCCL_MIN_CTAS=4 addressed transport-level inefficiencies that algorithm and protocol selection alone cannot resolve.
Summary
This blog demonstrated that NCCL’s auto-selected algorithm and protocol are not always optimal for a given topology, and that systematic profiling with Linaro MAP provides the visibility needed to identify and resolve communication bottlenecks in distributed GPU workloads. Across three experiments, varying NCCL algorithms, protocols, and transport-level settings, MAP enabled us to diagnose each configuration’s behaviour without any code changes or code recompilation.
The performance gains can be summarised with Performance Reports, where we can compare the baseline with the optimised experiment C results.
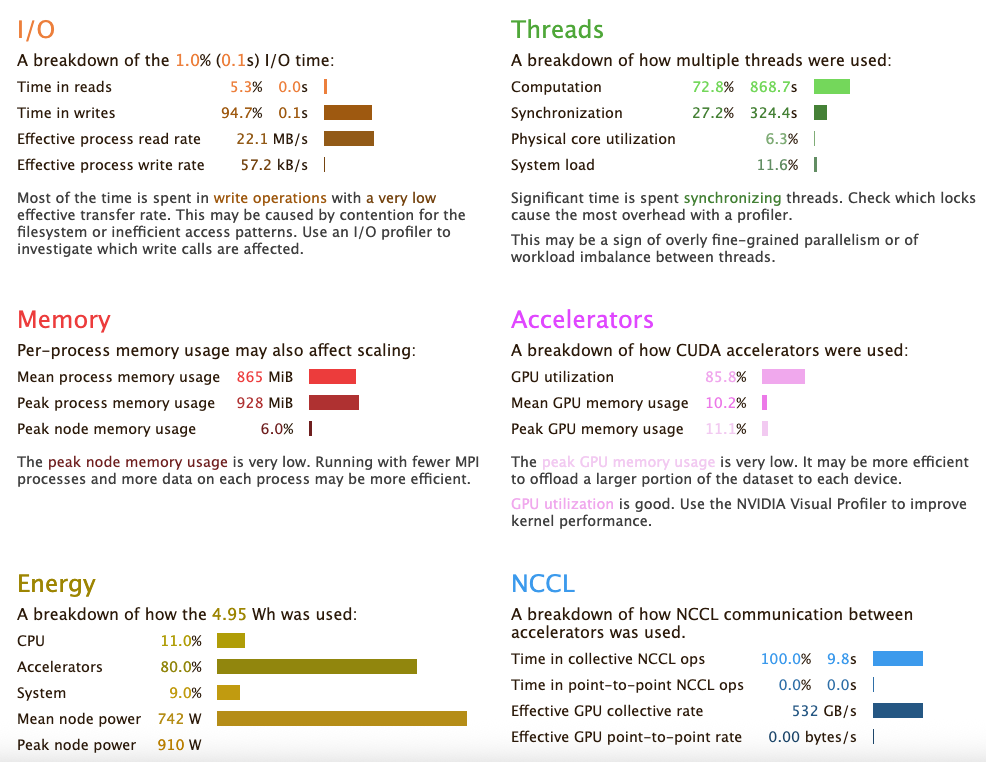
Baseline
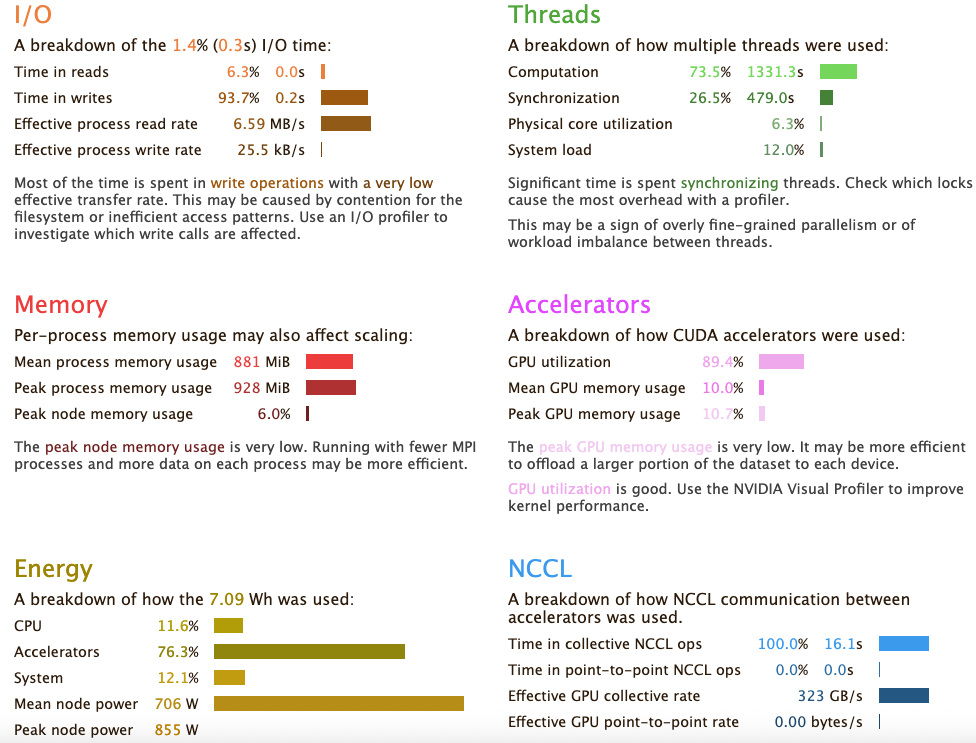
Baseline performance report
Experiment C
Experiment C performance report
We can see that we have improved the I/0 of the application, alongside the NCCL communication. This has lead to the application running faster and has had a significant positive impact on the power consumption of the run. Now that the NCCL collectives are tuned on the system, we are able to run a larger ML application and be sure that the NCCL AllReduce kernels will run efficiently.
Prerequisites
- NCCL ≥ 2.27.3 (earlier versions do not expose the profiling events MAP requires)
- Linaro Forge 26.0
Final Thoughts
If you are training at scale and want visibility into your communication patterns, we would love to hear from you. Please contact the Linaro Forge team at forge-suport@linaro.org and we will be happy to help you get started.
About the Author
Name: Rudy Shand
Job Title: Principal Field Application Engineer
Email address: rudy.shand@linaro.org
Bio: Rudy Shand is a leading expert in high-performance computing (HPC) debugging and profiling, currently serving as a Principal FAE at Linaro. With over 14 years of experience in the field, Rudy specializes in optimizing, debugging, and porting complex HPC codes to ensure maximum program correctness and scalability.
His career includes a decade-long tenure at Arm, where he focused on the development and quality of Arm-based debuggers and profilers. Since joining the Linaro Forge team in 2022, Rudy has transitioned into a pivotal role driving technical debugging and profiling expertise across HPC and AI/ML communities.
An accomplished speaker and educator, Rudy has delivered key technical talks and training workshops at major industry events, including SOS’27, CUG, ATPESC, and ISC. He holds a degree in Cybernetics and Electronic Engineering from the University of Reading. Rudy is dedicated to empowering developers to conquer the challenges of modern parallel programming, from single-node systems to the world’s largest supercomputers